Penrith
4 units available
$2,758–$2,858 psf
99.1% sold
Zyon Grand is selling now in D03 (RCR, Central region). Everything below is compiled from matched transactions, URA tender data and public sources.
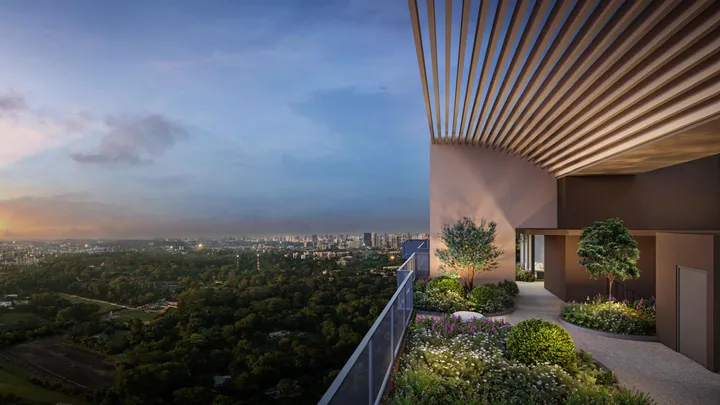
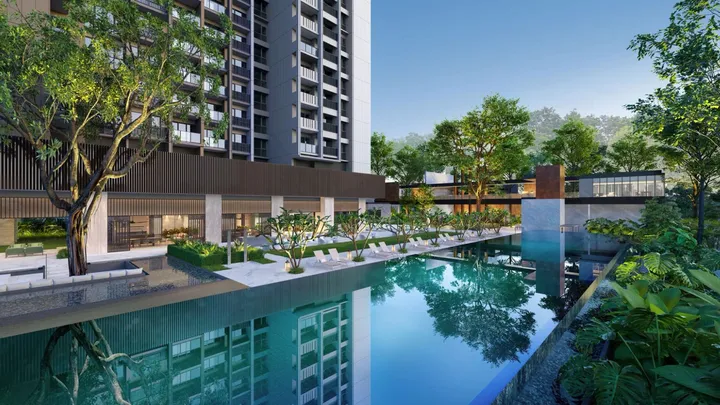
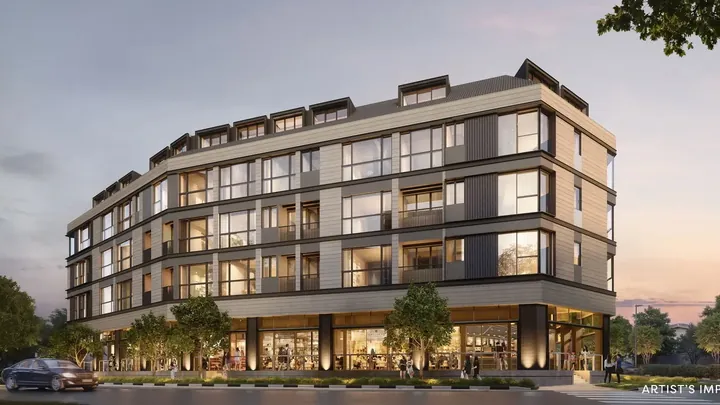
Zyon Grand in D03 — 14 developer images. Select any image to view it full size.
Artist impressions and marketing images are supplied by the developer and compiled by PropertyInsider.sg. They are indicative only, may show upgraded finishes or landscaping that is not part of the standard specification, and are not a representation of the completed development. Verify the specification against the developer’s sales documents.
Zyon Grand is a 706-unit 99-year leasehold condominium in D03 (RCR, Central region), developed by City Developments Limited (CDL) & Mitsui Fudosan, with TOP expected in 2032. The land was secured through a URA Government Land Sales tender in April 2024 at $1,202 psf ppr.
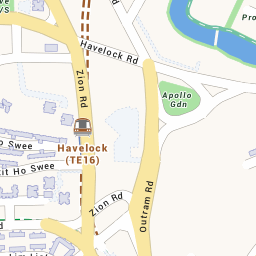
The site sits about 0.25 km in a straight line from Havelock (TE16), roughly 4 minutes on foot. Matched developer-sale transactions put take-up at 90% — 637 of 706 units, at an average of $3,056 psf.
This overview is generated from PropertyInsider.sg’s tracked record for this project — URA tender data, matched caveat transactions and public filings — not from developer marketing material. Figures as at 20 Oct 2026. Anything marked (est.) is our estimate and is explained where it appears.
The full tracked record for Zyon Grand, grouped by what it tells you. Every figure here is repeated in context further down the page, with its source and its caveats.
Compiled by PropertyInsider.sg from URA tender records, matched caveat transactions and public filings; last refreshed 20 Oct 2026. Values marked (est.) are our estimates — the launch-price method is set out in our pricing methodology.
Estimates are anchored on the site's estimated breakeven rate and a measured developer margin band; developers make final pricing decisions. Indicative quantums apply the estimated psf range to typical unit sizes — not a price list.
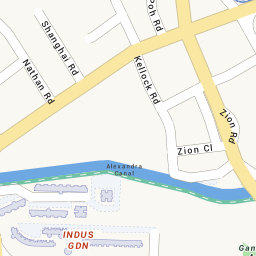
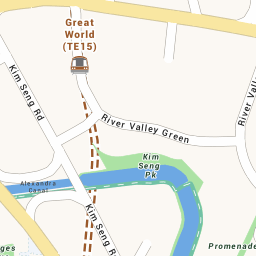
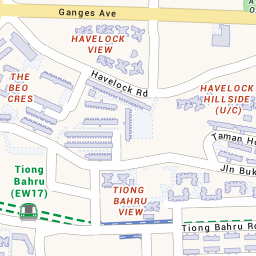
Where Zyon Grand sits on the map, with its district, market segment and nearest station on the rail network. The nearest MRT station is Havelock (TE16), about 0.25 km away in a straight line, roughly 4 minutes on foot. The dashed rings on the map mark straight-line 1 km and 2 km radii from the site.
Zyon Grand is located at 1.29065, 103.83369 in D03, Singapore. The interactive map loads when this section comes into view.
Open this location in Google Maps·Every tracked launch on one map·Primary schools map
The marker is an approximate site centroid compiled by PropertyInsider.sg, not a surveyed boundary. Station distances are straight-line, measured from the site centroid to the midpoint of a station’s published exits (LTA MRT/LRT exits dataset) — not the distance to the nearest exit, and not a walking route. Walking times are an estimate only and are omitted beyond 2 km. Base map tiles are © OneMap / Singapore Land Authority. Verify exact addresses, boundaries and journey times with the developer or on OneMap.
Stations, schools, shops, food, green space, healthcare and the main employment areas around this address, grouped by type. Each place shows an estimated road distance, an off-peak drive time and, within 2 km, a walk.
| Place | By road | Drive | Walk |
|---|---|---|---|
| Havelock MRTTE16 · Thomson-East Coast Line | 0.3 km | — | 4 min |
| Great World MRTTE15 · Thomson-East Coast Line | 0.6 km | — | 6 min |
| Tiong Bahru MRTEW17 · East West Line | 1.2 km | 3 min | 13 min |
| Fort Canning MRTDT20 · Downtown Line | 1.6 km | 3 min | 18 min |
| Place | By road | Drive | Walk |
|---|---|---|---|
| River Valley Primary SchoolPrimary school, moderate P1 demand | 0.6 km | — | 7 min |
| Zhangde Primary SchoolPrimary school, p1 vacancies available | 1.5 km | 3 min | 16 min |
| Alexandra Primary SchoolPrimary school, very high P1 demand | 1.5 km | 3 min | 16 min |
| Cantonment Primary SchoolPrimary school, p1 vacancies available | 2.5 km | 5 min | 27 min |
| CHIJ (Kellock)Primary school, p1 vacancies available | 2.5 km | 5 min | 28 min |
| Gan Eng Seng SchoolSecondary | 1.5 km | 3 min | 17 min |
| Crescent Girls' SchoolSecondary · Girls | 2.5 km | 5 min | 27 min |
| School of the Arts, SingaporeSecondary through JC | 2.6 km | 6 min | 29 min |
| Dimensions International CollegeInternational school | 1.3 km | 3 min | 14 min |
| NPS International SchoolInternational school | 2.5 km | 5 min | 28 min |
| St. Gallen Institute of Management in AsiaOverseas business school | 1.3 km | 3 min | 15 min |
| Duke-NUS Medical SchoolJoint campus | 1.4 km | 3 min | 16 min |
| Place | By road | Drive | Walk |
|---|---|---|---|
| Concorde Shopping CentreShopping mall | 0.3 km | — | 3 min |
| Great WorldShopping mall | 0.5 km | — | 5 min |
| Big BlockShopping mall | 0.8 km | — | 9 min |
| Valley Point Shopping CentreShopping mall | 1.1 km | — | 12 min |
| Place | By road | Drive | Walk |
|---|---|---|---|
| Zion Riverside Food CentreHawker centre · 32 cooked-food stalls | 0.5 km | — | 5 min |
| Havelock Road Cooked Food CentreHawker centre · 30 cooked-food stalls | 0.7 km | — | 8 min |
| Tiong Bahru MarketHawker centre · 83 cooked-food stalls | 0.9 km | — | 10 min |
| Place | By road | Drive | Walk |
|---|---|---|---|
| Fort Canning ParkPark · 19 ha | 2.1 km | 4 min | 23 min |
| Place | By road | Drive | Walk |
|---|---|---|---|
| Kim Seng CCCommunity club | 0.5 km | — | 5 min |
| Tiong Bahru CCCommunity club | 1.1 km | 2 min | 12 min |
| Henderson CCCommunity club | 1.7 km | 4 min | 19 min |
| Place | By road | Drive | Walk |
|---|---|---|---|
| Singapore General HospitalPublic acute hospital | 1.7 km | 4 min | 19 min |
| Outram PolyclinicPublic polyclinic · SingHealth Polyclinics | 1.7 km | 4 min | 19 min |
| Place | By road | Drive | Walk |
|---|---|---|---|
| Tanjong PagarCentral business district | 2–5 km | 5–10 min | — |
| Raffles PlaceCentral business district | 2–5 km | 5–10 min | — |
Road distances and drive times are estimates: the straight line from the site centroid to each place, with a 1.35× allowance for the road network, driven at an average 28 km/h. That is off-peak driving, not a routed journey, with no allowance for traffic, one-way roads or parking; drive times under 800 m are left out. Walks assume 80 m/min with a 1.2× routing allowance and are left out past 2 km. Each place is one representative point, so a park or a business district is not measured to its nearest entrance, and workplaces are shown as a band. Sources: NEA, NParks, SportSG, People’s Association, MOE, MOH and URA/JTC, compiled by PropertyInsider.sg; primary schools from our schools dataset and rail from the LTA exits dataset. Check journeys you rely on with OneMap. Primary-school admission uses the straight-line home-school distance, shown in the schools section below.
Matched developer-sale transactions by bedroom type: average price, average psf, transacted price range, size range and units sold. Entry prices usually reflect lower floors or less ideal facings.
| Type | Avg price | Avg psf | Transacted range | Size range | Units sold | Available |
|---|---|---|---|---|---|---|
| 1 Bedroom | $1.39M | $2,935 | $1.3M – $1.52M | 474 sqft | 32 | 27 left474 sqft |
| 2 Bedroom | $1.98M | $3,021 | $1.48M – $2.35M | 538 – 721 sqft | 227 | 9 left721 sqft |
| 3 Bedroom | $2.9M | $3,101 | $2.2M – $3.72M | 818 – 1,076 sqft | 290 | 3 left818 sqft |
| 4 Bedroom | $4.5M | $3,035 | $3.97M – $5.54M | 1,421 – 1,615 sqft | 87 | 11 left1,615 sqft |
| 5 Bedroom | $10.39M | $3,907 | $10.39M – $10.39M | 2,659 sqft | 1 | 19 left1,819–2,756 sqft |
Prices, sizes and unit counts are compiled unit by unit from lodged caveats and developer sales records, updated 26 Aug 2026. Sold figures cover transacted units only; the available column counts unsold units of the same type. Averages vary by floor, stack and facing — ranges matter more than any single number.
The published site plan for Zyon Grand — block placement, facing, and where the facilities sit relative to each stack. Select a plan to view it full size.
Site plans are developer marketing material compiled by PropertyInsider.sg. Block positions, unit counts, facing and facility placement are indicative and can change between the marketing plan and the approved building plan. Confirm against the developer’s sales documents and the approved plans before relying on a stack, facing or distance.
The developer’s elevation chart for Zyon Grand: the stacks floor by floor, with the unit type in each. Read it with the site plan above to place a unit in the block. Select the chart to view it full size.
Elevation charts are developer marketing material compiled by PropertyInsider.sg. Stack numbering, floor counts and the unit type shown for each stack are indicative and can change before the approved building plan. Check any unit against the developer’s sales documents and price list.
14 floor plans across 12 unit types for Zyon Grand. Pick a type to narrow the set, then select a plan to view it full size.
Floor plans are developer marketing material compiled by PropertyInsider.sg. They are not to scale, and layouts, areas and fittings are indicative and subject to change and to the approved building plan. Plan names follow the developer’s own labels. Confirm the strata area and layout of a specific unit in the sales brochure before relying on it.
5 virtual tours of Zyon Grand, hosted by the developer’s tour providers. Each one opens in a new tab.
Virtual tours are produced for the developer and hosted on third-party sites outside PropertyInsider.sg, which does not control their content. Showflat units usually carry upgraded finishes, loose furniture and decor that are not part of the standard specification, and some tours show a model rather than a built unit.
Every unit in Zyon Grand, floor by floor and stack by stack: which are sold, which are still available, and what the sold ones transacted at. 69 of 706 units were unsold at the last update.
Select any unit for its size, layout and — where it has sold — the transacted price and date. Availability reflects the most recent update and can change without notice; confirm with the developer before acting on it.
| Tower | Stack | Layout | Units | Sold | Available | Median psf |
|---|---|---|---|---|---|---|
| Tower 3 | 01 | 4BR / 5BR | 59 | 40 | 19 | $2,970 |
| Tower 3 | 02 | 3BR | 58 | 58 | — | $3,134 |
| Tower 3 | 03 | 3BR | 59 | 59 | — | $3,108 |
| Tower 3 | 04 | 2BR | 59 | 50 | 9 | $3,010 |
| Tower 3 | 05 | 2BR | 59 | 59 | — | $3,012 |
| Tower 3 | 06 | 3BR | 59 | 56 | 3 | $3,063 |
| Tower 5 | 07 | 3BR | 58 | 58 | — | $3,132.5 |
| Tower 5 | 08 | 4BR / 5BR | 59 | 48 | 11 | $3,084 |
| Tower 5 | 09 | 3BR | 59 | 59 | — | $3,108 |
| Tower 5 | 10 | 2BR | 59 | 59 | — | $3,032 |
| Tower 5 | 11 | 1BR | 59 | 32 | 27 | $2,930.5 |
| Tower 5 | 12 | 2BR | 59 | 59 | — | $3,061 |
Unit-level data compiled by PropertyInsider.sg from lodged caveats and developer sales records, updated 26 Aug 2026. Availability is a snapshot, not a live feed — units can be sold or released between updates, and developers hold back stock. Verify anything you intend to act on with the developer. Compare pricing across projects on the prices by bedroom table.
The ten most recent recorded sales at Zyon Grand — the closest read on what buyers are paying right now, and on which layouts are still moving.
| Date | Unit | Type | Size | Price | Price psf |
|---|---|---|---|---|---|
| 26 Aug 2026 | #56-06 | 3BR | 818 sqft | $2.81M | $3,429 |
| 25 Jul 2026 | #04-08 | 4BR | 1,421 sqft | $4.39M | $3,088 |
| 4 Jul 2026 | #44-04 | 2BR | 721 sqft | $2.34M | $3,242 |
| 23 Jun 2026 | #48-08 | 4BR | 1,615 sqft | $5.49M | $3,400 |
| 22 Jun 2026 | #42-08 | 4BR | 1,421 sqft | $4.71M | $3,314 |
| 21 Jun 2026 | #58-06 | 3BR | 818 sqft | $2.79M | $3,417 |
| 5 Jun 2026 | #54-11 | 1BR | 474 sqft | $1.51M | $3,190 |
| 4 Jun 2026 | #60-06 | 3BR | 818 sqft | $2.81M | $3,431 |
| 16 May 2026 | #51-06 | 3BR | 818 sqft | $2.75M | $3,357 |
| 15 May 2026 | #52-06 | 3BR | 818 sqft | $2.75M | $3,364 |
Most recent transaction 26 Aug 2026. Caveats are lodged with a lag, so the newest sales at a project may not appear for several weeks. Source: lodged caveats and developer sales records, compiled by PropertyInsider.sg.
Capital appreciation context for Zyon Grand: what sellers of completed condos in the same district actually realised on 6,748 matched buy-and-sell pairs (March 1995 to October 2026), including the 10.0% that sold at a loss.
Resale lines: median exit psf of all matched resales, profitable and not, from 2010, smoothed as a 4-quarter moving average. Quarters with fewer than 5 exits carry no point. Zyon Grand: median psf of its new sales in each quarter with at least 3 recorded sales (637 sales in all), from lodged caveats and developer sales records. A new launch is priced against resale stock that is older and on a shorter remaining lease, so compare direction and the size of the gap, not the levels alone. Source: URA caveat data, matched pairs.
Completed condos in D03 with at least 20 matched exits — the closest historical read on what this location has delivered. Ranked by median annualised return across every exit, not only the profitable ones.
Map of the 10 projects ranked below. Each pin is labelled with that project’s median annualised return.
| Project | TOP | Exits | Profitable | Median ann. return | Median hold | Median gain | Avg psf |
|---|---|---|---|---|---|---|---|
| Alexis | 2012 | 304 | 100.0% | 10.7% p.a. | 4.3y | $279k | $1,326 |
| Meraprime | 2006 | 207 | 100.0% | 10.1% p.a. | 5.9y | $702k | $2,300 |
| Twin Regency | 2007 | 214 | 98.6% | 9.7% p.a. | 4.1y | $620k | $2,425 |
| The Regency at Tiong Bahru | 2010 | 157 | 100.0% | 8.6% p.a. | 3.7y | $540k | $1,187 |
| The Metropolitan Condominium | 2009 | 494 | 97.6% | 7.2% p.a. | 4.1y | $509k | $1,068 |
| Stirling Residences | 2022 | 447 | 99.8% | 4.6% p.a. | 5.1y | $283k | $1,850 |
| Queens | 2002 | 752 | 93.6% | 4.5% p.a. | 9.5y | $550k | $2,010 |
| Artra | 2020 | 99 | 100.0% | 4.1% p.a. | 5.8y | $506k | $1,871 |
| Margaret Ville | 2021 | 85 | 100.0% | 3.8% p.a. | 5.4y | $312k | $1,858 |
| Queens Peak | 2020 | 250 | 98.8% | 3.5% p.a. | 6.0y | $250k | $1,788 |
Projects in the same district with at least 20 matched exits, ranked by median annualised return across every exit — profitable and not. Median gain is gross, before stamp duties, legal and agent fees, mortgage interest and renovation. Realised outcomes of past projects are context, not a prediction for this launch. Full dataset: resale exit dashboard.
What the developer paid for this site, ranked against the sites most like it — same market segment and planning region where we have enough of them, widening only if we do not. Land is the largest single input into a launch price and it is fixed two to three years before the show flat opens. Every tracked site sits on the land cost tracker.
MOE primary schools within a straight-line 1km and 2km of this project, with each school's P1 demand tier and phase-by-phase oversubscription ratios from the last completed registration exercise. An address inside a school's 1km band ranks highest whenever that school ballots. Explore every school on the primary schools map.
Map of Zyon Grand and the 5 primary school(s) inside its straight-line 1km and 2km rings. It loads when this section scrolls into view; every school is listed below with its distance.
Phase chips show applicants per place: 1.00× or under every applicant placed, 1.01–1.50× oversubscribed, above 1.50× heavily oversubscribed. Distances are straight-line estimates computed from project and school coordinates and shown to 2 decimal places — they are not the official home-school distance. Walking times use the same model as the nearby-places table above: 80 m/min with a 1.2× allowance for street routing, omitted beyond 2 km. For P1 registration, verify the exact 1km/2km status with the OneMap School Query tool, which applies MOE’s official measurement. No guarantee of accuracy; school demand tiers reflect the 2026 P1 exercise and can change year to year. The tier is read from Phase 2C alone — the round for children with no family link to the school, and the only one where home distance decides who gets in. Very high demand means the 2C ballot cut into citizens within 1km AND at least 1.5 applicants turned up per place. Full map and methodology: primary schools near new launches.
Other tracked launches and GLS sites in D03 or the same segment and region.

What a loan of this size costs a month, before you talk to a bank. Change any figure — the instalment, the loan amount and the interest bill all recalculate as you type.
The split shown is the first month’s instalment, not an average: early payments are mostly interest and late ones mostly principal, while the monthly figure itself stays level. This is the loan only — it excludes stamp duty, legal fees, maintenance and property tax, and a home bought under construction draws the loan down in stages rather than all at once. What a bank will actually lend you depends on the LTV limit, TDSR and, for HDB flats and developer-sold ECs, MSR. Work those out on the affordability calculator, stamp duty calculator and progressive payment calculator. Estimates only, not financial advice.
The analysis on this page tells you what the data says. If you want to work through what it means for your own situation — budget, ABSD position, timing an HDB sale, or how this project compares with alternatives — you can request a one-to-one consultation.
Disclosure: advisory consultations are provided by Jamus Lee (CEA Reg. No. R065771E, ERA Realty Network Pte Ltd, Licence No. L3002382K), the publisher of PropertyInsider.sg, via JamusProperty.com. This is a separate service from our editorial research and has no influence over what we publish. See our editorial policy. Submitting this form shares your details with the advisory practice; see our privacy policy.