
Is Thomson Reserve a good investment?
On the evidence so far, Thomson Reserve looks like a sound family home in a proven part of District 20. The land under it is competitively priced, but not cheap. It does not look like the outsized investment the numbers around it suggest. The 56 resale sales used to make the case returned a middle 4.76% a year. Sort them by when the owner actually sold and every return above 6% belongs to a sale completed before 2017. Among the 31 completed from 2020 onwards, the middle was 4.36% and the best single result 6.06%.
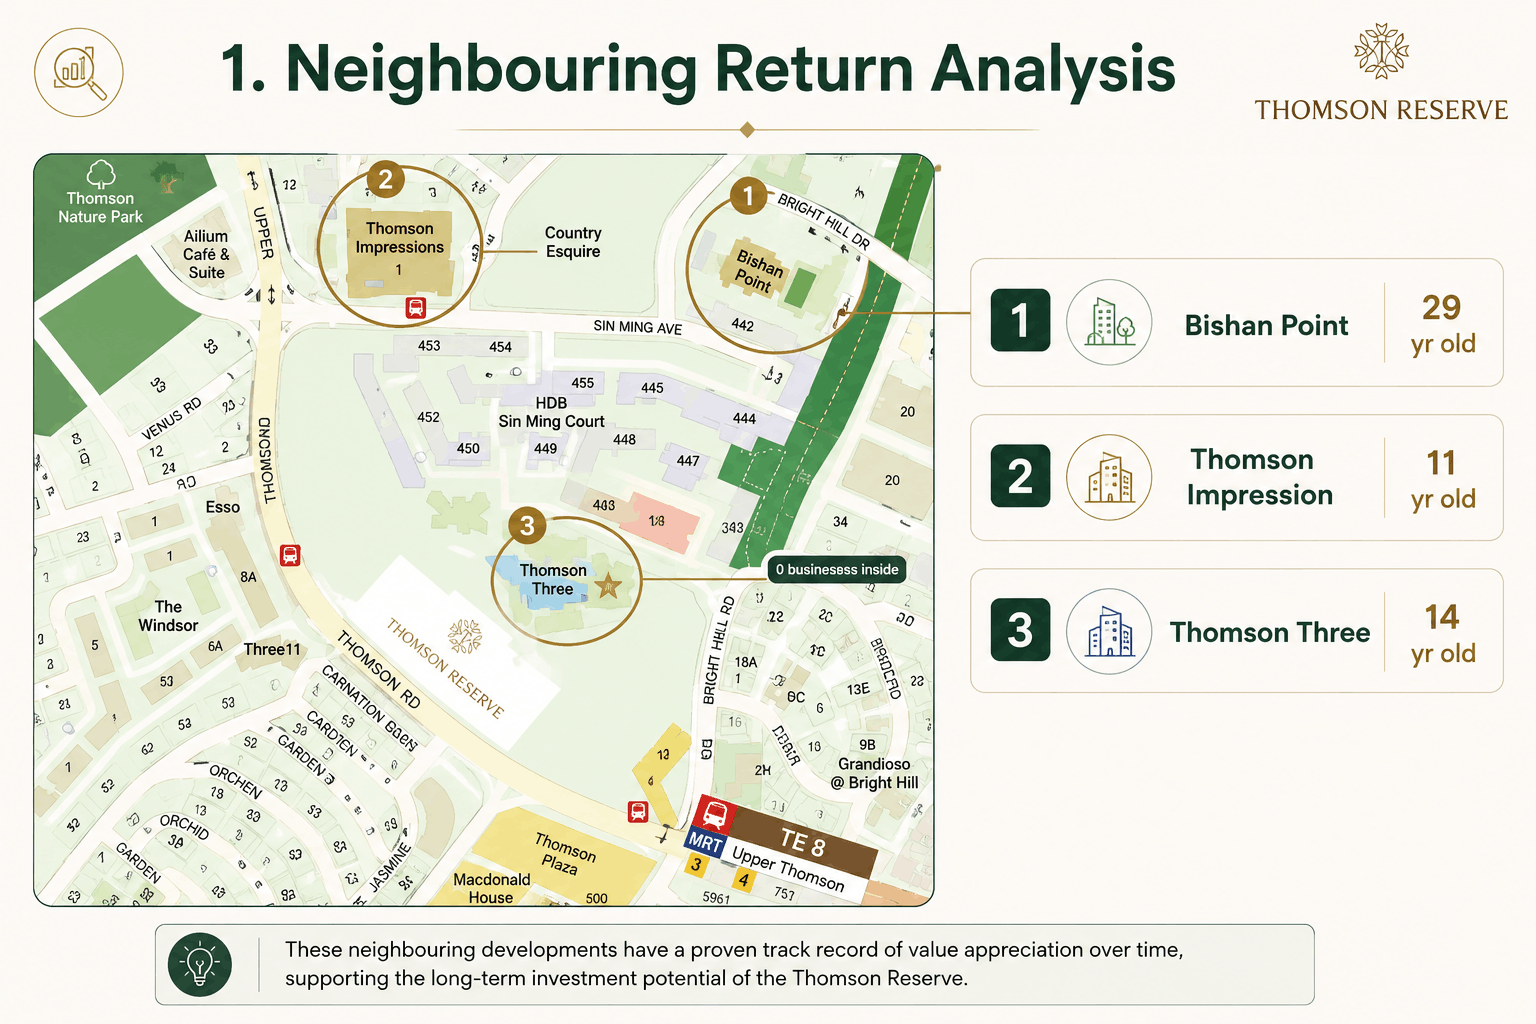
The project is a 1,268-unit condominium on a 99-year lease at Bright Hill Drive. UOL Group, Singapore Land Group and CapitaLand Development are building it on the former Thomson View site. The preview is targeted for October 2026 (est.). Three claims travel with it: the neighbours made good money, the land was bought cheaply, and the site sits inside Ai Tong School's 1km ring. All three are true as far as they go. Below we show how far that is.
What genuinely stands up
The dollar profits are real and large. The middle profit across the 56 sales was $307,000. One three-bedroom owner at Thomson Three sold in November 2025 for $736,112 more than they paid. Every sale shown made money, across rows running from 2007 to 2026. The deck is right to lead with that.
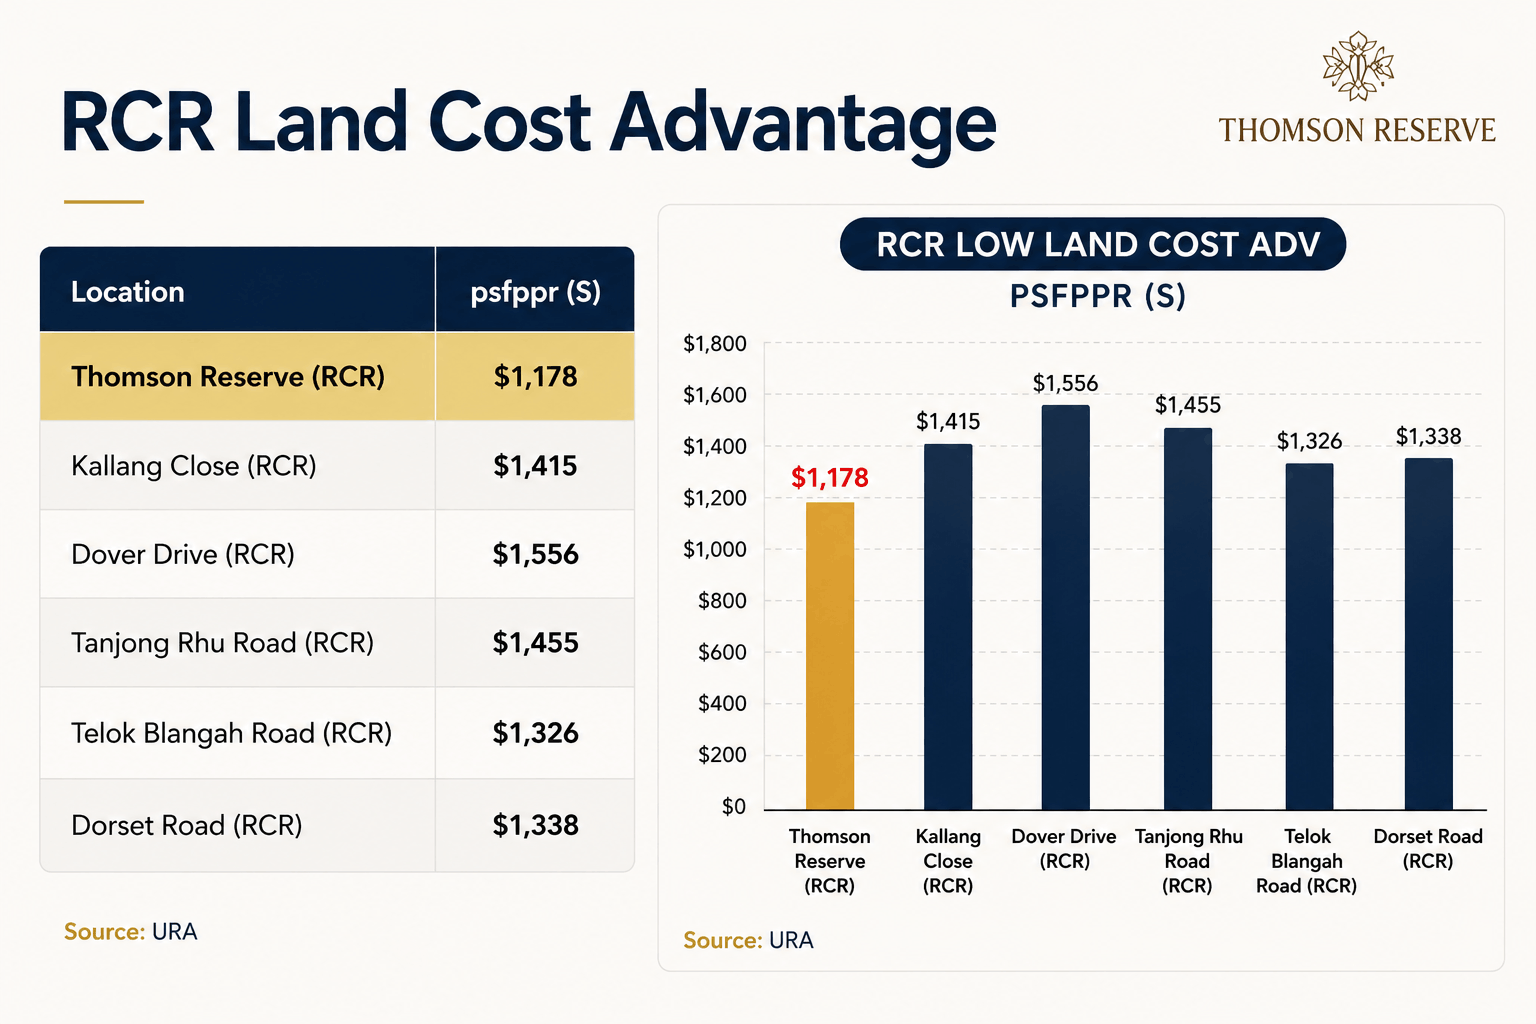
Age has not been punished, and the land is cheap against what follows. Bishan Point is 29 years into a 99-year lease. It still produced the strongest returns in the set, a middle of 5.88% a year. In many estates a lease that short starts to drag on price. And of the six upcoming RCR sites the deck compares, $1,178 is the lowest, with the next up costing 13% more. Bright Hill also becomes a two-line interchange. That has not happened yet, so it appears in none of the numbers below.
What did the 56 sales actually return?
Grouped as the deck groups them, with the number of sales behind each figure added, because some groups are very small.
| Project and unit type | Sales | Middle profit | Middle return | Range |
|---|---|---|---|---|
| Bishan Point, 2 bedroom | 11 | $220,000 | 5.88% | 3.89% to 8.95% |
| Bishan Point, 3 bedroom | 9 | $368,000 | 6.63% | 3.34% to 11.32% |
| Bishan Point, 4 bedroom | 5 | $550,000 | 5.88% | 3.06% to 11.85% |
| Thomson Impressions, 2 bedroom | 8 | $255,950 | 3.75% | 3.28% to 4.53% |
| Thomson Impressions, 3 bedroom | 8 | $540,600 | 5.09% | 3.56% to 6.06% |
| Thomson Three, 2 bedroom | 5 | $178,000 | 2.89% | 2.75% to 5.10% |
| Thomson Three, 3 bedroom | 10 | $596,000 | 4.57% | 2.55% to 6.01% |
| All 56 sales | 56 | $307,000 | 4.76% | 2.55% to 11.85% |
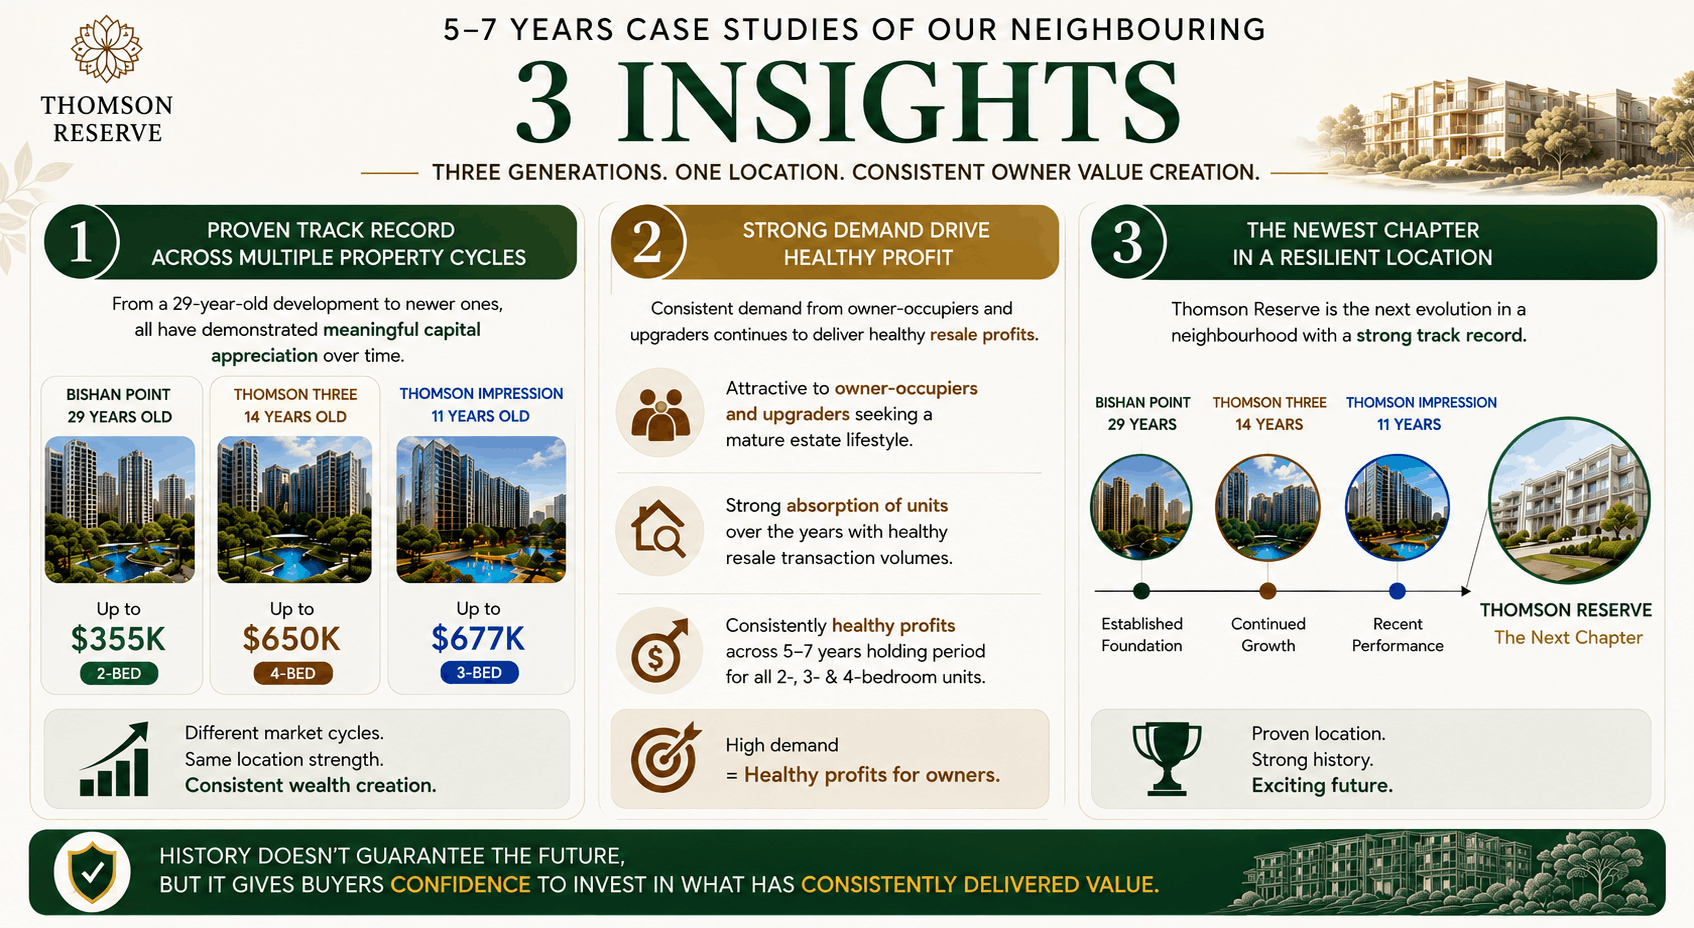
Two patterns stand out. Three-bedroom units beat two-bedroom units at both newer projects, by roughly 1.3 and 1.5 percentage points a year. That is useful when choosing a layout. And Bishan Point, the oldest of the three, produced the highest returns. A lease-decay story predicts the opposite. There is no four-bedroom row for the two newer projects because none sold in that window. The deck reads that as owners choosing to stay, which is plausible. It is also just an absence of evidence.
Why the 3% to 11% range needs a date attached
Both ends of that range are real. They just did not happen at the same time.
We sorted all 56 sales by the year the owner sold. The five highest returns were sales completed in 2011, 2012 and 2013. All ten of the highest came before 2017. That period covers the recovery after the global financial crisis and the run-up before the 2013 lending curbs, when prices rose quickly.
| Sold | Sales | Middle | Average | Best |
|---|---|---|---|---|
| 2007 to 2019 | 25 | 5.88% | 6.11% | 11.85% |
| 2020 to 2026 | 31 | 4.36% | 4.51% | 6.06% |
For anyone selling in the last six years, the honest range here is roughly 2.6% to 6.1% a year. Still positive, but different. Take a $1.9 million home held six years. The gap between 4.4% and 5.9% a year is worth about $200,000 before costs. The deck prints the rows and the dates sit on them. This is not a criticism of the data. It is a point about which figure to carry into a decision.
What the launch-to-today figures say
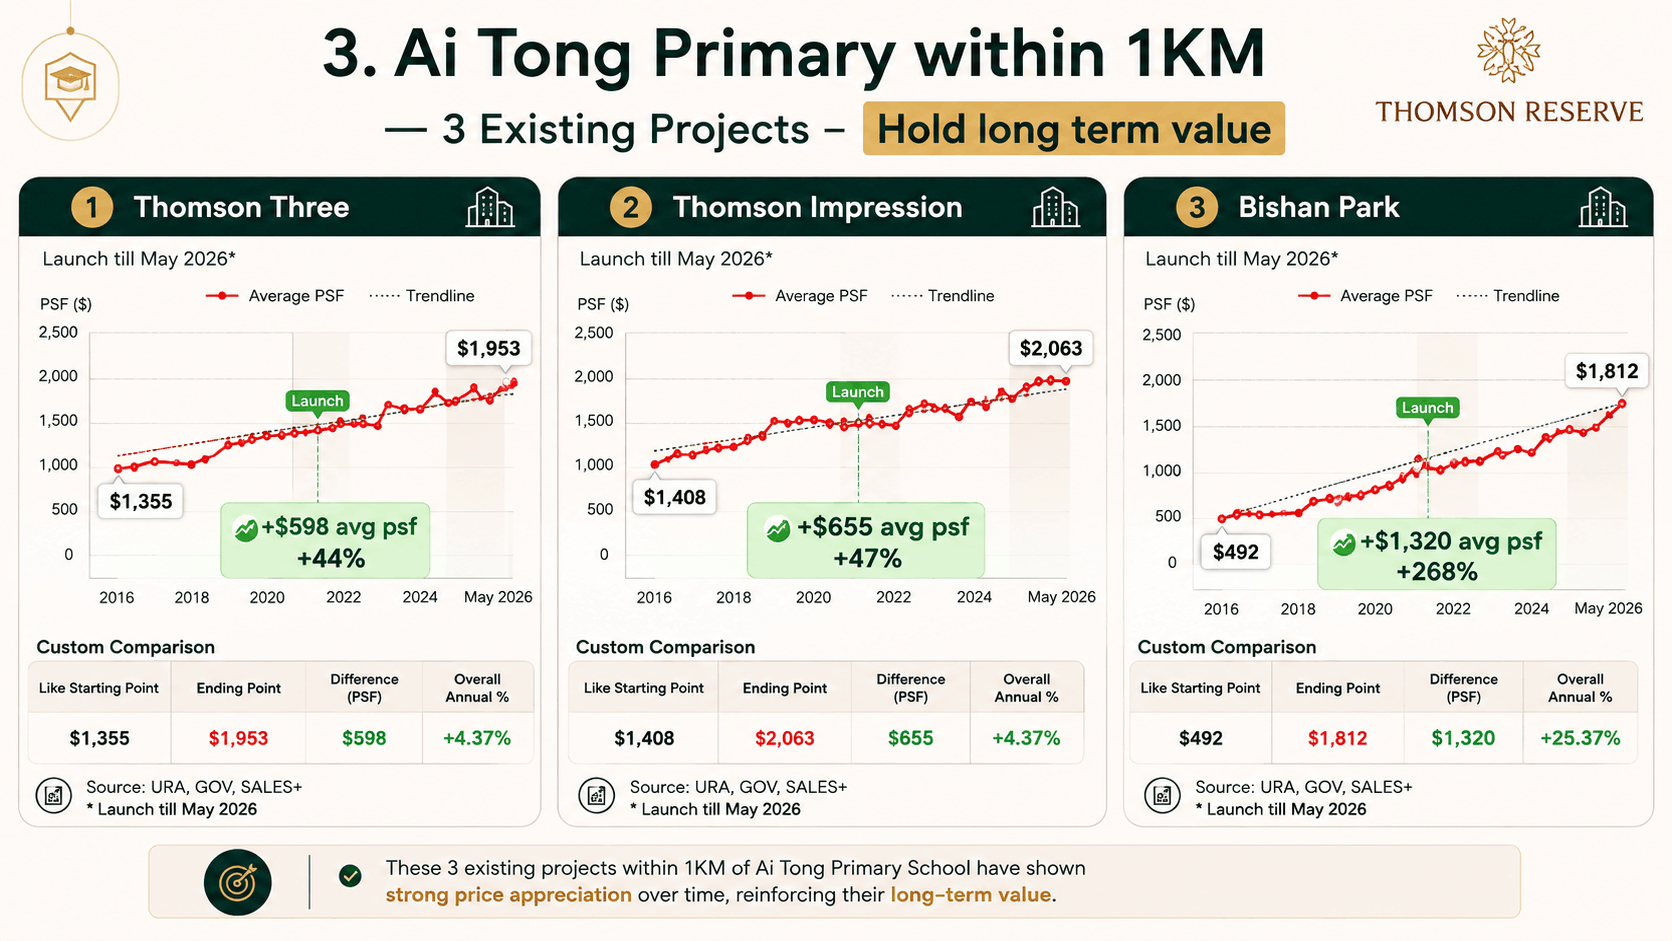
The deck shows a second measure, and it is the more complete one. It compares the average price per square foot at each project's launch with the average today. That covers all the units, not a selected group of sales, so it is the fairest single test here.
| Project | Launch | At launch | Latest | Total gain | In yearly terms |
|---|---|---|---|---|---|
| Thomson Three | Sep 2013 | $1,355 | $1,953 | +$598 psf, +44% | 2.92% |
| Thomson Impressions | Oct 2015 | $1,408 | $2,063 | +$655 psf, +47% | 3.70% |
| Bishan Point | Jul 2002 | $492 | $1,812 | +$1,320 psf, +268% | 5.68% |
These sit below the five-to-seven-year returns for the same projects. Thomson Three's owners as a whole made 2.92% a year since launch. The selected five-to-seven-year sellers made 4.36%. That is what you would expect when a set holds only profitable sales from a wider pool. If you want one number to plan around, use 2.92% and 3.70%. Those two opened as new builds, as Thomson Reserve will.
Why the 268% gain does not travel to a 2026 buyer
Owners who bought at launch in July 2002 paid $492 psf. Today the average is $1,812, so they are up 268%. The engine is the entry price. In 2002 the market was near the bottom of a long slump, and $492 psf was cheap even for its day. Over the 23.6 years since, that works out at 5.68% a year. Strong, but a long way from 268% as most people hear it.
Now do the sum a 2026 buyer faces. Suppose Thomson Reserve prices near $2,500 psf and you repeat Bishan Point's entire 23-year run, gaining the same $1,320 per square foot. On a $2,500 entry that is 53%, not 268%. Repeat Thomson Impressions' $655 and you are up 26%; Thomson Three's $598 and you are up 24%. Percentage gains are measured against what you paid. When the entry price is five times higher, the same dollar movement produces a fifth of the percentage. That is the most important adjustment to make to any historic return quoted around a new launch.
Is $1,178 psf ppr really the lowest land cost?
The land rate is sound. The former Thomson View was a 255-unit development on a 504,314 sq ft site. Owners sold it collectively for $810 million. Add the government charge and the premium for a fresh 99-year lease, and the cost works out at $1,178 per square foot of buildable space.
The boundary is the comparison set. Against the six upcoming RCR sites the deck picks, $1,178 is indeed the lowest. Against every RCR land deal in our compilation since January 2023, it ranks sixth of 13, where the middle rate is $1,191.
| Site or project | District | Date | Land cost (psf ppr) |
|---|---|---|---|
| The Sen | D21 | Aug 2024 | $841 |
| Hudson Place Residences | D05 | Mar 2025 | $1,037 |
| Artisan 8 | D20 | Apr 2024 | $1,059 |
| Emerald of Katong | D15 | Aug 2023 | $1,069 |
| Penrith | D03 | Aug 2024 | $1,154 |
| Thomson Reserve | D20 | Jul 2025 | $1,178 |
| Bloomsbury Residences | D05 | Feb 2024 | $1,191 |
Artisan 8 is the row to sit with. It is a small project in the same District 20, on land bought in April 2024 at $1,059 psf ppr. That is 10% cheaper than this site's.
The stronger version of the argument is that an RCR site cost less than OCR sites further out. Two are quoted, Lentor Central at $1,278 and Hougang Central at $1,179. Both are correct, and both are the two most expensive OCR deals of recent years. Our compilation holds 27 OCR land deals since January 2023. The middle rate is $905 psf ppr, and 22 of the 27 cost less than this site's. Lentor Gardens Residences went for $920 in the same estate. RCR land at an OCR price would be rare; RCR land above most OCR land is ordinary. That does not make $1,178 a bad number next to a coming interchange. It is just not the safety margin the framing implies. Every awarded site we track sits in the government land sales pipeline tracker.
What does the land cost imply about launch pricing?
Land is the largest single cost in a launch price, which is why a cheaper site matters. It is also why a cheaper site rarely becomes a cheap home. Developers price at a multiple of what they paid. That multiple has to cover construction, borrowing, marketing and profit. Across the 55 launched projects in our land cost tracker the middle multiple is 2.15 times land cost, and across the 22 RCR projects 2.11. The sum, so you can check it: $1,178 multiplied by 2.11 gives $2,486 psf. Our indicative range is $2,450 to $2,700 psf (est.), from the model in our pricing methodology. One caution on the top of that range: land bought from 2023 onwards has launched at about 2.30 times, nearer $2,712 psf. None of it is developer-confirmed.
Lower land cost shows up as a lower launch price than the projects that follow. It does not show up as extra room to grow after you buy. The saving has already been handed to you at the till.
Does the Ai Tong School catchment add value?
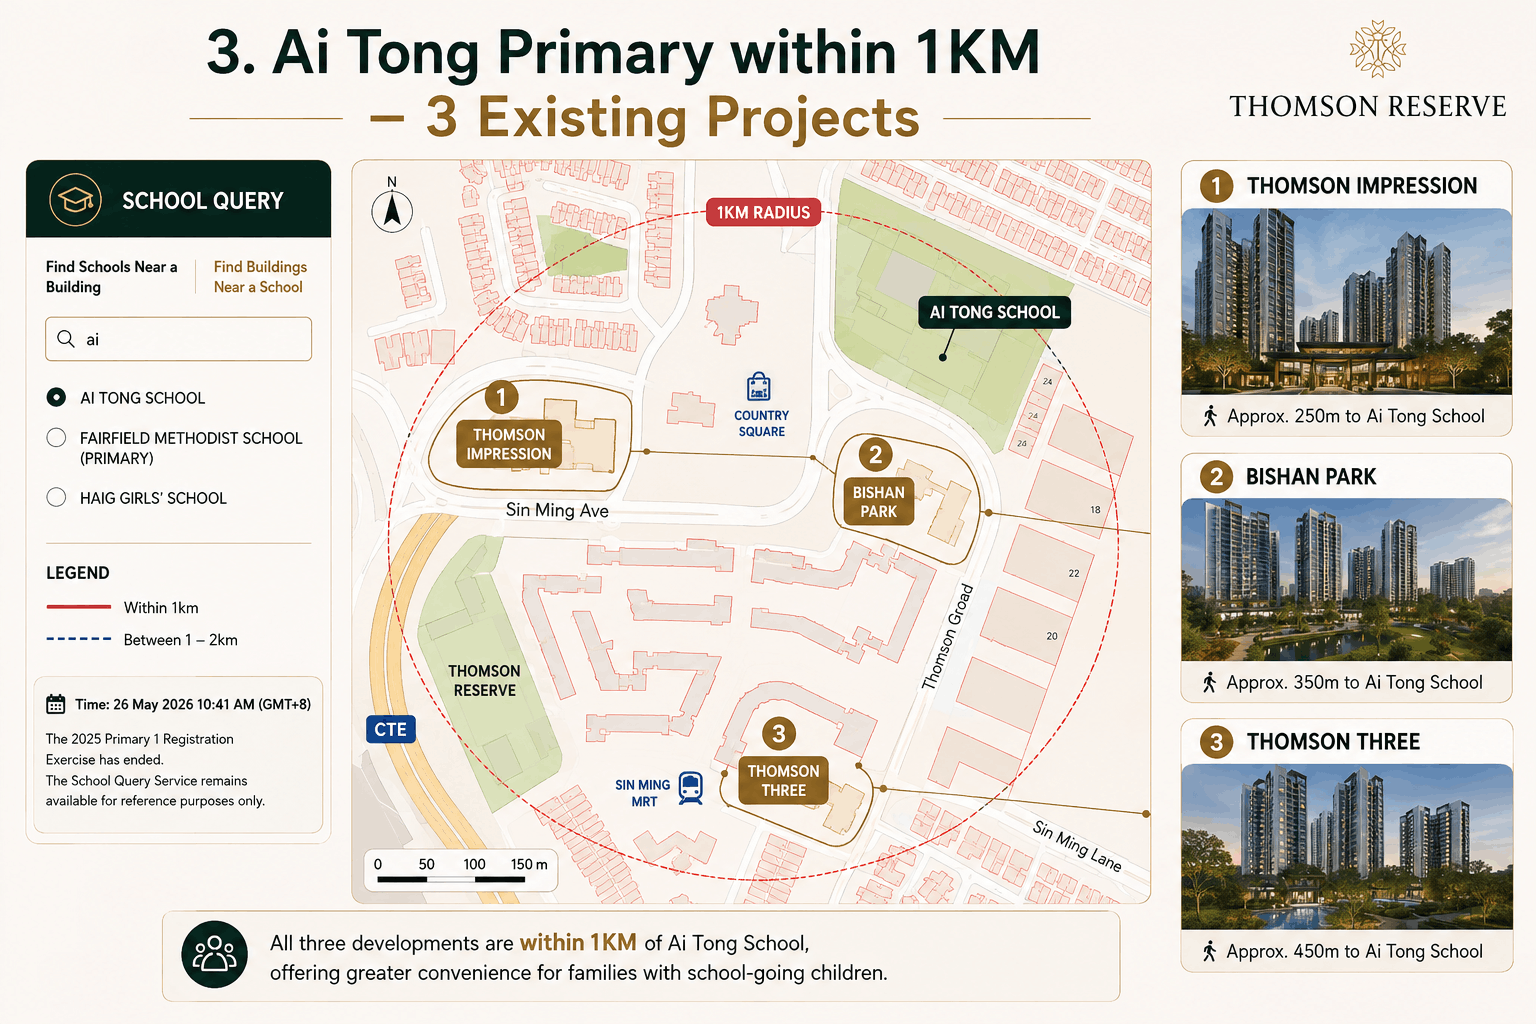
Thomson Reserve is inside Ai Tong School's 1km ring, about 0.57km away, and our schools compilation places Ai Tong in the top demand tier. Straight-line distances are estimates, not the official MOE home-to-school distance, so check an exact address with the OneMap School Query service.
What matters is what the ring bought in 2025. Phase 2C is the stage open to children with no family link to the school. At that stage Ai Tong balloted among Singapore Citizens within 1km. Applicants between 1km and 2km never reached allocation. So the ring is doing work, but it buys entry to a ballot, not a place. MOE publishes the balloting figures each year alongside the phase definitions.
On price, our own work cuts against the simple version of the claim. We mapped all 182 MOE primary schools against 107 tracked launches in the 1km question. In the OCR, projects within 1km of a top-tier school price about 4.6% higher. In the RCR the relationship reverses and they price about 4.3% lower. Thomson Reserve is an RCR project. What holds in both rings is who buys: a 7.2 percentage-point higher share of HDB upgraders. A strong catchment changes your future buyer pool rather than adding a premium. Check the rings on our primary schools map.
What this analysis cannot tell you
Only winners are shown, and the groups are small. Losses are absent by design. So we can say how large the gains were, not how often owners made one. Five sales sit behind Thomson Three's two-bedroom figure. One unusual sale moves a group that size. The 56-row total is sturdier, and the launch-to-today figures sturdier still.
All gains are before costs. Stamp duty, mortgage interest, agent and legal fees and maintenance are excluded from every number above. Over a five-year hold, interest alone eats a large share of a 4% yearly gain. Homes bought from 4 July 2025 carry the four-year Seller's Stamp Duty schedule of 16%, 12%, 8% and 4%, published by IRAS. And no pricing exists yet, so the launch price will settle most of the argument.
Where could this reading be wrong? The Cross Island Line. None of these historic sales sit in a period when Bright Hill was a two-line interchange. Here is the test that would prove us too cautious. If resale prices at Thomson Impressions and Thomson Three rise faster than the wider District 20 market in the two years after the line opens there, the interchange effect is real. If they track the district, it is not.
What it means for different buyers
- Buying a home for a decade or more. Reasonable, on the evidence of Bishan Point at 5.68% a year since launch.
- An HDB upgrader in Bishan or Ang Mo Kio. The order you do things in matters more than the launch-day price. See our sell HDB, buy new launch guide and the TDSR guide.
- Investing on a five to seven year view. Recent sales cleared a middle 4.36% a year before costs, and none beat 6.06%. A plan needing more needs a longer hold or another project. Line launches up in the comparison tool.
- Weighing resale instead. Thomson Impressions and Thomson Three average $2,063 and $1,953 psf, on leases already 11 and 14 years old. See the project page, the price dataset and upcoming launches.
The short version
- The 56 sales presented are all real and all profitable, returning a middle 4.76% a year. Every return above 6% belongs to a sale completed before 2017. Since 2020 the middle is 4.36% and the best 6.06%.
- The two projects that opened as new builds returned 2.92% and 3.70% a year since launch, the closest comparisons to a 2026 purchase.
- Bishan Point's +268% needs a July 2002 entry of $492 psf. The same dollar gain on a $2,500 entry is +53%.
- $1,178 psf ppr is sixth-cheapest of 13 RCR land deals since January 2023, and dearer than 22 of 27 recent OCR deals.
- Cheap land buys a lower launch price, not extra growth afterwards. Our estimate is $2,450 to $2,700 psf (est.).
- Inside Ai Tong's 1km ring you get a ballot ticket, not a place, and the ring shows no RCR price premium.
So what should you do with this? Decide your holding period honestly, because the evidence favours ten years over five. Then run your own sum in the affordability calculator. Use $2,450 to $2,700 psf (est.) and about 3% growth, costs off the top. When the price list lands, check it against the $2,486 our multiple implies.
Key findings
- Resale sales presented, all three projects, all profitable56
- Middle return across all 56 sales4.76% a year
- Middle return, the 31 sales completed 2020 to 20264.36% a year
- Thomson Three, launch 2013 to today, in yearly terms2.92% a year
- Land rate ranked against RCR deals since Jan 20236th of 13
Four terms, in plain words
- psf pprWhat a developer paid for land, per buildable sq ft
- Annualised returnA total gain spread evenly over the years it took
- RCR / OCRRest of Central Region, the city-fringe middle ring (Thomson Reserve), and Outside Central Region, the outer ring (Lentor, Hougang)
- Seller's Stamp DutyTax if you sell within four years of buying
Frequently asked questions
Is Thomson Reserve a good investment?
On the evidence available in August 2026, Thomson Reserve looks like a sound long-term family home rather than a high-return investment. The 56 resale sales presented for its three neighbours returned a middle 4.76% a year. But every result above 6% came from a sale completed before 2017. Among the 31 sales since 2020 the middle was 4.36% and the best was 6.06%.
What did Thomson Reserve's neighbouring projects actually return?
Across the 56 profitable resale sales presented at the July 2026 ERA agent seminar, the middle profit was $307,000. The middle annualised return was 4.76%. By project, the middle returns were 5.88% a year at Bishan Point, 4.36% at Thomson Three and 3.96% at Thomson Impressions. All sales shown were profitable, so they show the size of gains, not how often owners made one.
Does Bishan Point's 268% gain apply to a Thomson Reserve buyer?
Not in percentage terms. Bishan Point's owners bought at $492 per square foot in July 2002 and are at $1,812 today. That is $1,320 per square foot over 23.6 years, or 5.68% a year. A buyer entering near $2,500 who repeated that dollar gain would be up about 53%, because percentage returns are measured against what you paid.
Does Thomson Reserve really have the lowest RCR land cost?
Only against the small set of upcoming sites it is compared with. At $1,178 psf ppr it ranks sixth of the 13 RCR land deals in our compilation since January 2023. The middle rate there is $1,191. Cheaper deals include Artisan 8 in the same District 20 at $1,059 and The Sen at $841.
Is Thomson Reserve's land cheaper than OCR land?
It is cheaper than the two OCR sites usually quoted, Lentor Central at $1,278 and Hougang Central at $1,179. But those are the two most expensive recent OCR deals. Across 27 OCR land deals since January 2023, the middle rate is $905 psf ppr and 22 cost less than Thomson Reserve's $1,178.
How much will Thomson Reserve cost per square foot?
PropertyInsider.sg estimates an indicative launch range of $2,450 to $2,700 psf (est.). Across 22 RCR projects, launch prices came in at a median 2.11 times land cost. Applied to $1,178 psf ppr, that gives $2,486 psf. Land bought since 2023 has launched at 2.30 times, implying about $2,712. These are analyst estimates, not developer-confirmed pricing.
Sources and methodology
How we checked this
Two sources do the work. The first is the deck shown to ERA agents on 15 July 2026, sourced there to URA and SALES+. It lists 56 resale sales across Bishan Point, Thomson Impressions and Thomson Three, each with a date, price, profit and annualised return. We typed out every row and recalculated the middle values. Nothing in its arithmetic was wrong. What changes the reading is how the rows are grouped, which is a choice, not a calculation.
The second is our own compilation of 256 government tenders and collective sales since 2016, which powers the land cost tracker. We used it to place the $1,178 psf ppr land rate against the whole market, not the handful of sites the deck picked. We left out our wider resale exit database on purpose. None of this measures risk. Every one of the 56 sales made money, and sales that lost money are not shown. These figures say how large the winning gains were, not how often owners won.
Where the figures come from
The resale figures come from one document: the deck presented at an ERA agent seminar on 15 July 2026, "5 Essentials You Must Know to Close More at Thomson Reserve". It cites URA and SALES+ throughout. We transcribed all 56 rows and recomputed the middle and average returns, the by-bedroom groups and the split by year of sale. We also converted the launch-to-today gains into yearly rates. URA explains what caveat data covers in its REALIS coverage notes, and the series is on data.gov.sg. We did not verify individual caveats against URA records.
Land rates come from our compilation of 256 tenders and collective sales since 2016, cross-checked against URA land sales records. Region labels follow URA's market segments. The 2.15, 2.11 and 2.30 multiples come from our project dataset and are published in the land cost tracker.
Some Thomson View details follow reporting at the time rather than a primary document we fetched. Those are the $810 million price, the $1,178 psf ppr working, the 504,314 sq ft site and the 1 July 2025 High Court order. The unit count and preview date follow UOL Group's February 2026 results presentation, as reported. Primary 1 figures come from our compilation of 182 MOE schools and OneMap points.
Disclaimer. This article is independent research for general information and education, not financial, investment, legal or property advice. Gain figures are gross and exclude stamp duties, interest and fees. The source material contains profitable sales only, so no figure here indicates the probability of a gain, and small groups may not be representative. Figures marked (est.) are analyst estimates. Data is compiled in good faith as at 4 August 2026 but is not guaranteed; verify against URA, MOE and IRAS before deciding. Our editorial and disclosure practices are set out in our editorial policy.
Update history
- Wording pass. The How we checked this notes moved from the top of the article into Sources & methodology. Region names now use URA's CCR, RCR and OCR labels, and several phrases were simplified. No figures changed.
- Rewritten on one source document, the ERA agent seminar deck of 15 July 2026, with all 56 rows recomputed by us, plus our land sales compilation. New sections split returns by year of sale, convert launch-to-today gains into yearly rates, show why a 268% gain does not travel to a 2026 entry price, and widen the land-cost comparison to every RCR and OCR deal since January 2023. Slide images are placeholders pending the source artwork.
- Published. Next update when the developer price list is released.