
What is Holland Plain, and what has been sold so far?
Holland Plain is a new housing estate off Holland Road in District 10. It covers about 34 hectares, or roughly 47 football fields. The URA Master Plan sets aside eight plots there for homes, plus a wetland park and an open green space called a community plain. Two plots have been sold so far. Both went to the same developer, Sim Lian Group.
The first plot, Holland Link, was sold on 7 August 2025 at $1,432 psf ppr. It will become Amberwood at Holland, a 212-unit development of six-storey blocks on a 99-year lease, previewing around September or October 2026 (est.). The second plot, Holland Plain (Parcel B), followed on 7 May 2026 at $1,491 psf ppr, for about 280 units. Six plots have not been released yet.
On getting around: the nearest station is King Albert Park on the Downtown Line, and the future Cross Island Line will add a second line in the area. Marketing material puts the walk at about 680m, or roughly eight minutes (est.). We have not measured that ourselves, so treat it as indicative until addresses are issued.
Three terms used throughout this article
- psf pprWhat the developer paid for land, per square foot of floor space it is allowed to build
- Plot ratioHow much floor space may be built, compared with the size of the land. A higher number means a taller, denser project
- Core Central Region (CCR)The central and most expensive part of Singapore, including Districts 9, 10 and 11
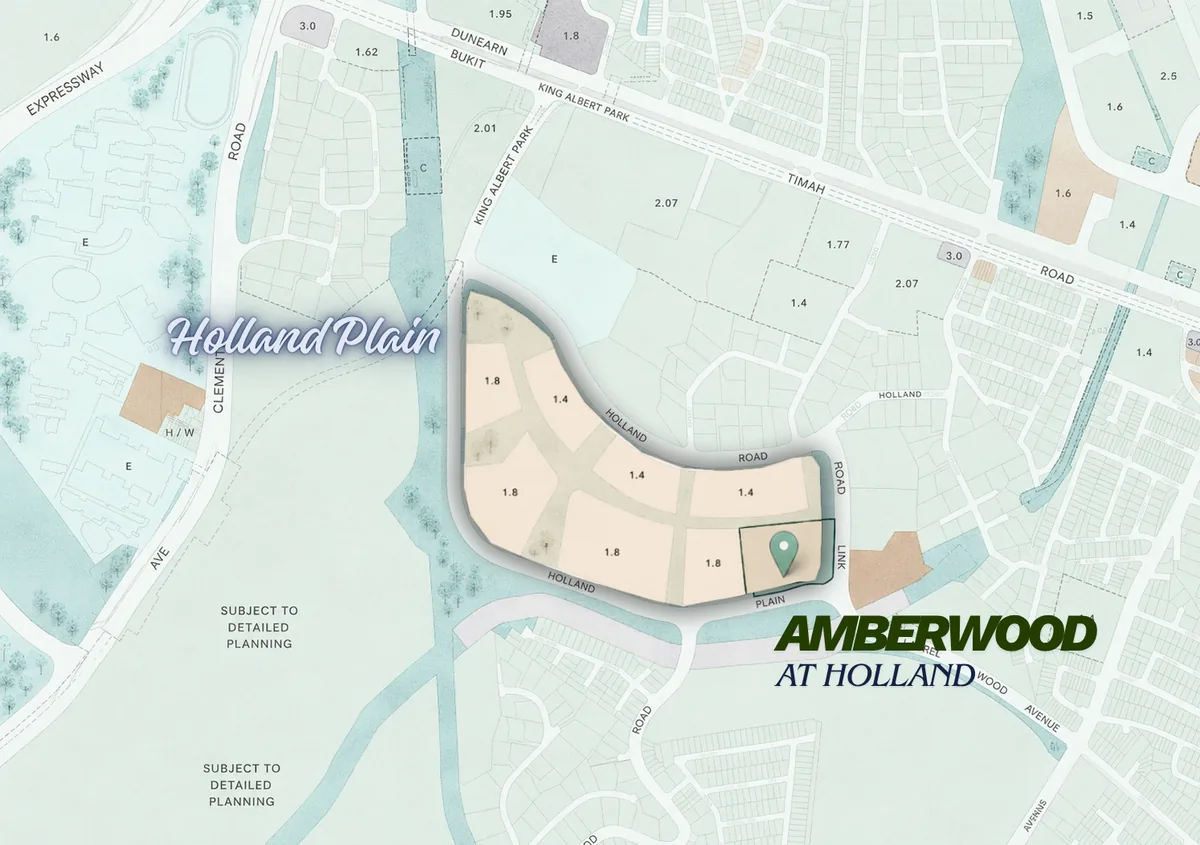
Here is the argument being made about the estate. The first project into a brand new area buys its land before anyone knows what the area will become. So it pays a price set with little to compare against. If the area turns out well, that first buyer captures the gain.
It is a fair argument. It is also much easier to make than to check. So we checked it.
Key takeaways
- Plots sold in Holland Plain2 of 8, both to Sim Lian Group
- Amberwood at Holland land price$1,432 psf ppr, Aug 2025
- Rank among CCR land sales since Jan 2025Lowest of 8
- Gap to the middle price of those 8 ($1,625)11.9% below
- Gap to Peck Hay Road ($1,865)23.2% below, not 30.2%
- A cheaper CCR plot if you look back furtherHolland Drive, $1,285, May 2024
- Site size and land per home17,069 sqm, 80.5 sqm per unit
- Our launch price estimate$3,000–$3,500 psf (est.)
The short version — read this first
Here are the seven things worth knowing before you read the full analysis below.
What we found
- The cheap land is real, but the lead is small$1,432 psf ppr is the lowest of eight recent central-region plots, yet two others sit within $22 of it
- The 30.2% claim is the wrong way roundAmberwood's land is 23.2% cheaper than Peck Hay Road's. Using 30.2% could leave you budgeting about $240,000 too little
- There is a reason the land was cheapA 1.4 plot ratio and a six-storey limit mean less floor space to sell, so developers bid less. Not a bargain the market missed
- The low density is real and rare80.5 sqm of land per home, over five times the most tightly packed project we compared. But it comes from the same building limit that made the land cheap, so it is one advantage, not two
- The location has never lost moneyAll eight nearby projects gained, across 1997, 2008 and Covid. But the yearly return is 1.9% to 5.6%, middle 3.2%, not the headline 38% to 252%
- Being within 1km buys a ballot, not a placeIn 2025, 54 citizen applicants within 1km competed for 45 places at Phase 2C. Roughly a one-in-six chance of missing out
- Selling later will be harder212 units, nothing below three bedrooms, and the estate's park and green spaces still unbuilt. Fine for a long stay, a real constraint if you plan to sell in four or five years
So what should this tell you? The first-mover argument holds up, but for a narrower reason than the one being promoted. It rests on one fact: the second plot sold for 4.1 per cent more than the first, which points to the second project launching near $3,130 psf (est.) rather than cheaper. It does not rest on the park and green spaces promised for the estate, which have no completion date, and it does not rest on the 30.2 per cent figure.
None of that makes this a weak project. A low-rise, low-density home on a 99-year lease in District 10, within walking distance of a Downtown Line station, is a genuinely scarce thing, and the location has held its value through every downturn we can measure. The question is not whether the product is good. It is whether the launch price leaves you anything, and that is not answerable until Sim Lian prices the units.
Two questions to bring to the preview. Ask what the monthly maintenance fee will be, because 212 households share a large site. And ask how the developer justifies the price against the $3,010 psf our land-price model points to. To see what this price range means for your own budget, start with the affordability calculator.
How we checked this
Land prices, bid counts and sale dates come from our own land cost tracker. We compared all eight plots in the Core Central Region sold under Government Land Sales between 1 January 2025 and 15 July 2026. Government Land Sales is the programme through which the state sells land to developers. We left out collective sales, where owners of an older development sell the whole site together, because those are priced differently.
Primary 1 figures come from our own schools dataset. Details of the building, the mix of unit sizes and the past-project case studies come from an ERA consumer seminar held on 30 July 2026, presented by Ryner Koh, Executive Director of Agency at ERA Realty Network. Where our sums differ from the seminar's, we show our working. Full details are in sources and methodology.
Is $1,432 psf ppr really the lowest land price in the Core Central Region?
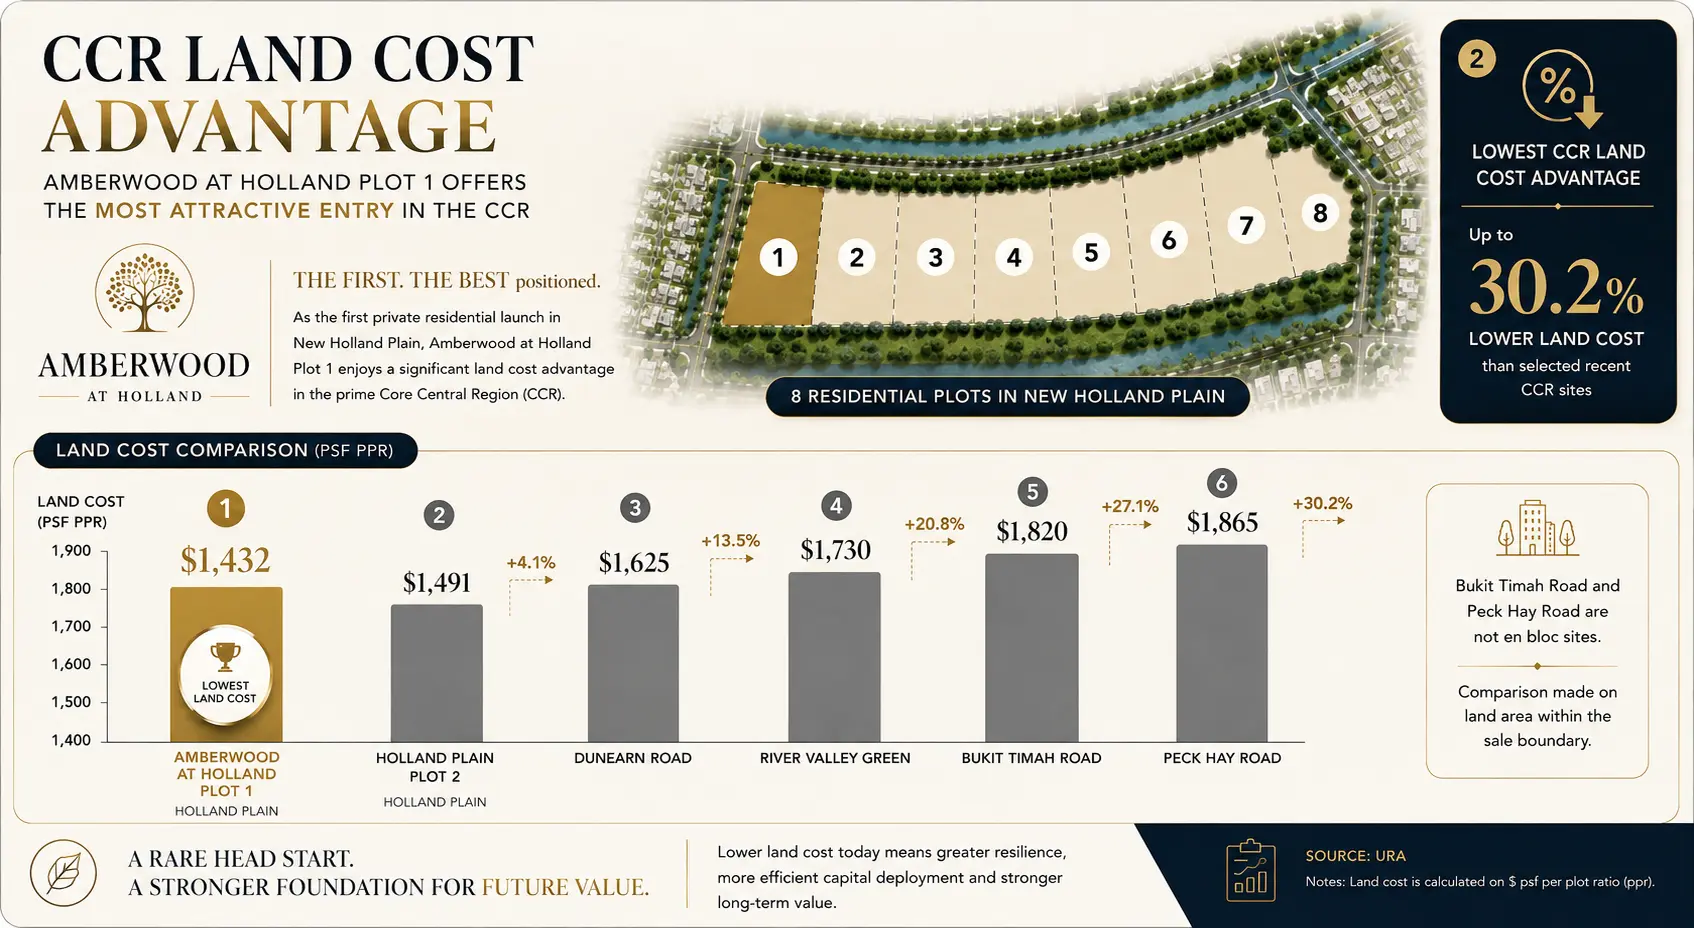
Over the past eighteen months, yes. Amberwood at Holland's $1,432 psf ppr is the lowest of the eight Core Central Region plots sold since January 2025. It sits 11.9 per cent below the middle price of that group, which is $1,625 psf ppr. Below is the full list, not a selection from it.
| Site | Sold | District | Land price (psf ppr) | Est. units | Bids |
|---|---|---|---|---|---|
| Holland Link (Amberwood at Holland) | Aug 2025 | D10 | $1,432 | 230 | 5 |
| Dunearn Road (Dunearn House) | Jul 2025 | D11 | $1,410 | 380 | 9 |
| River Valley Green (Parcel B) | Feb 2025 | D09 | $1,420 | 360 | 5 |
| Holland Plain (Parcel B) | May 2026 | D10 | $1,491 | 280 | 1 |
| Dunearn Road (Plot 2) | Apr 2026 | D11 | $1,625 | 335 | 6 |
| River Valley Green (Parcel C) | Jun 2026 | D09 | $1,730 | 470 | 4 |
| Bukit Timah Road | Nov 2025 | D11 | $1,820 | 340 | 8 |
| Peck Hay Road | Jun 2026 | D11 | $1,865 | 380 | 4 |
Two things that headline leaves out.
First, the lead is very small. Amberwood is only $22 psf ppr cheaper than River Valley Green (Parcel B), and $22 more expensive than Dunearn House. That is a spread of about 1.5 per cent. Three plots are effectively priced the same. "Lowest" here means lowest within a tight bunch.
Second, the answer changes if you change the time window. Look back another fifteen months and you find the Holland Drive plot that became Skye at Holland. It sold at $1,285 psf ppr in May 2024, about 10 per cent cheaper than Amberwood, in the same district. So this is the lowest price of the current cycle, not the lowest ever.
That comparison needs one caveat in Amberwood's favour. The Holland Drive plot is a high-rise site with a plot ratio of 4.7, so a developer there had far more floor space to sell. On the reasoning below, a site like that should normally cost more per square foot of floor space, not less. It sold cheaply because bids came in under what analysts expected at the time. So Holland Drive being cheaper does not weaken the point about Amberwood. It shows that in 2024, developers were wary of large prime sites too.
Why the 30.2 per cent figure is misleading
You may have seen a claim that Amberwood's land is 30.2 per cent cheaper than recent Core Central Region land. The sum behind it is correct. The wording is not.
Here is what the 30.2 per cent actually measures. Peck Hay Road sold at $1,865 psf ppr. Amberwood sold at $1,432 psf ppr. Peck Hay Road is 30.2 per cent more expensive than Amberwood. That is the correct way to read it.
Now turn the question around, which is what a buyer really wants to know. How much cheaper is Amberwood than Peck Hay Road? The answer is 23.2 per cent, not 30.2 per cent.
Both numbers describe the same gap. They just start counting from different points.
Think of a shirt priced at $100, on sale at $80. You saved 20 per cent. But $100 is 25 per cent more than $80. Same $20 gap, two different percentages, depending on which price you start from. The bigger-sounding number is always the one measured up from the cheaper price.
Here is why that matters to you. Buyers use the land price to guess the launch price. If you believe the land was 30.2 per cent cheaper, you will expect the homes to be roughly 30.2 per cent cheaper too, and you will set your budget accordingly. That expectation would be too low.
Put rough numbers on it. Apply our 2.1 multiple to Peck Hay Road's land, and a project there would launch at around $3,900 psf (est.). Take 30.2 per cent off that and you would expect about $2,720 psf. Take the correct 23.2 per cent off and you get about $2,995 psf. The difference is roughly $275 psf, or about $240,000 on an 872 sq ft unit.
So this is not a small technical point. Reading the figure the wrong way round could leave you expecting a home to cost a quarter of a million dollars less than it will. That is why our table shows dollar prices rather than percentages, and why we would rather you compare $1,432 against $1,865 directly.
Why does central land cost less than city-fringe land here?
Because the price is not for the land itself. It is for the amount of floor space you are allowed to build on it. And this plot is allowed to build far less than its neighbours.
The limits on this plot are set by URA, and they are published. In the annex to URA's tender announcement of 3 December 2024, the Holland Link site is listed with a site area of 17,069 sqm (about 183,731 sq ft), a maximum floor area of 23,897 sqm, and a maximum building height of six storeys. Divide the floor area by the site area and you get a plot ratio of 1.4. The site also sits beside Good Class Bungalow Areas, which are zones of large landed homes with strict planning rules, and that is the usual reason a plot in this position is capped low.
Now check the sums. That 23,897 sqm of floor area is about 257,200 sq ft. Sim Lian bid $368.37 million. Divide the bid by the floor area and you get $1,432 psf ppr, almost to the dollar. The headline number checks out against URA's own published figures.
The same annex carries two conditions that rarely get mentioned. URA capped the number of homes at 233 for this plot, stating the reason as managing traffic in the area. And it required the developer to set aside at least 500 sqm of floor area for a childcare centre. Both matter, and we come back to the 233 cap below.
Now compare that with Peck Hay Road and River Valley Green (Parcel C). Those are high-rise sites with much higher plot ratios. A tall building lets a developer spread its fixed costs across many more square feet of space it can sell. Those fixed costs include the land itself, the foundations, the basement, the lift shafts and the professional fees.
A six-storey project cannot do that. It has fewer square feet to sell, so each one carries a bigger share of those costs. A developer bidding on a low-rise plot therefore bids less for the land, to end up with the same profit. The low land price is not a bargain the market missed. It is the market pricing in a site that costs more to build on.
That said, one comparison from the seminar still stands out. Amberwood's central-region land price is lower than two plots sold in the Rest of Central Region during the same period. The Rest of Central Region is the city fringe, just outside the centre. Tanjong Rhu Road sold at $1,455 psf ppr in February 2026, and Dover Drive at $1,556 psf ppr in March 2026. A central plot selling for less than city-fringe land is unusual. As we set out in our first-half 2026 GLS review, city-fringe land prices have risen sharply, while low-rise prime land has not.
What launch price does this point to?
We estimate $3,000 to $3,500 psf (est.). That is the same range published on our Amberwood at Holland page, and this analysis does not change it.
Here is how we get there, with the full workings in our pricing methodology. We track projects where we know both the land price and the later selling prices. Across those projects, launch prices come in at about 2.1 times the land price. Apply that to $1,432 psf ppr and you get roughly $3,010 psf. That sets the bottom of our range.
The finishes push the other way. The seminar lists 3.2m ceilings throughout, marble and ducted air-conditioning in selected units, and appliances from V-ZUG, Villeroy & Boch and Liebherr. Those cost money, and the developer will want to recover it in the price. That is why our range runs above $3,010.
One more useful sum. Apply the same 2.1 multiple to Holland Plain (Parcel B) at $1,491 psf ppr, and you get about $3,130 psf (est.). That is the first solid reason to think the second project in this estate will not be cheaper than the first. This is the first-mover argument at its strongest, and it rests on land prices, not on the park and green spaces promised for the estate, which have no confirmed funding or completion date.
What about the other six plots?
Six plots were still unsold as at 3 August 2026, with plot ratios between 1.4 and 1.8. When they are released is up to the Government Land Sales programme, so both the timing and the prices are still open. We record each confirmation in our GLS pipeline tracker.
The only real evidence we have on where prices are heading is Parcel B. It sold at $1,491 psf ppr, which is 4.1 per cent higher than the first plot nine months earlier. Prices went up, but only a little.
The bid count tells you more. Five developers bid for the first plot. Only one bid for Parcel B, when analysts had expected as many as six. A single bidder can still pay a fair price, and Sim Lian did. But a sale that draws one bid tells you appetite for low-rise prime land is thin right now. Keep that in mind when you read the argument that later plots will keep pushing prices up.
Parcel B has its own page at Holland Plain (Parcel B) GLS, with the tender data and our estimate. Developer marketing material for that plot, including unit sizes and floor plans once confirmed, is collected at Holland Plain Residences. The independent numbers to judge that material against are on this page.
How strong is the Methodist Girls' School argument?
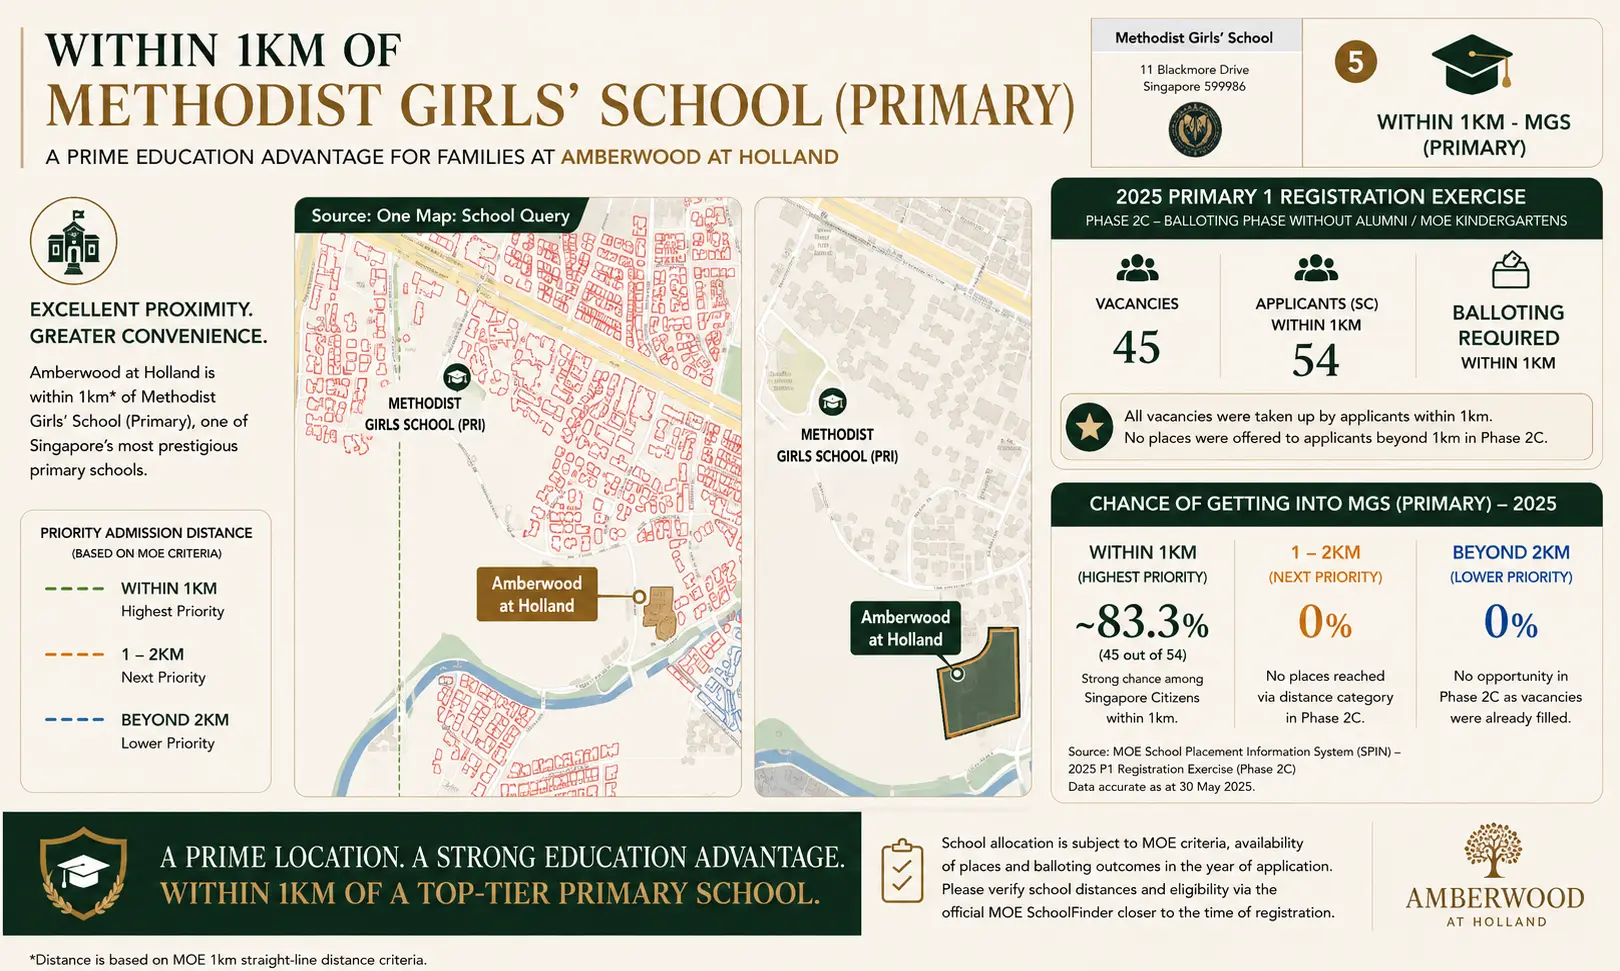
The seminar presents Amberwood at Holland as being within 1km of Methodist Girls' School (Primary) at 11 Blackmore Drive. That claim is based on a OneMap School Query, which measures the distance in a straight line.
All distances in this article are straight-line estimates. MOE uses its own official home-to-school distance for Primary 1 registration. Confirm your unit's address with the OneMap School Query and MOE once addresses are issued.
Now to the part that actually decides whether your child gets in. In the 2025 Primary 1 exercise, Methodist Girls' School (Primary) had 45 places at Phase 2C and 78 applicants. Phase 2C is the stage open to children with no family or other link to the school, so it is the phase most new buyers will face.
Because there were more applicants than places, the school had to ballot. The ballot was held among the 54 Singapore Citizen applicants living within 1km. All 45 places went to that group. So living within 1km gave a child roughly an 83 per cent chance of a place. Living outside 1km gave no chance at all that year. Phase 2B, the earlier stage for children whose parents volunteer at the school or belong to a linked organisation, also had to ballot, with 35 citizen applicants within 1km competing for 22 places. Our schools dataset places this school in the highest demand band on 2025 figures.
So the main point holds up. Living within 1km was the difference between having a chance and having none. What does not hold up is the idea that 1km secures a place. It secured a place in a ballot, with roughly a one-in-six chance of missing out. And the 2026 exercise was still running on the day we published, so those numbers may change.
Our wider work on this is in what P1 ballot data actually shows, and you can see the mapped 1km rings for every project we track on the primary schools proximity map.
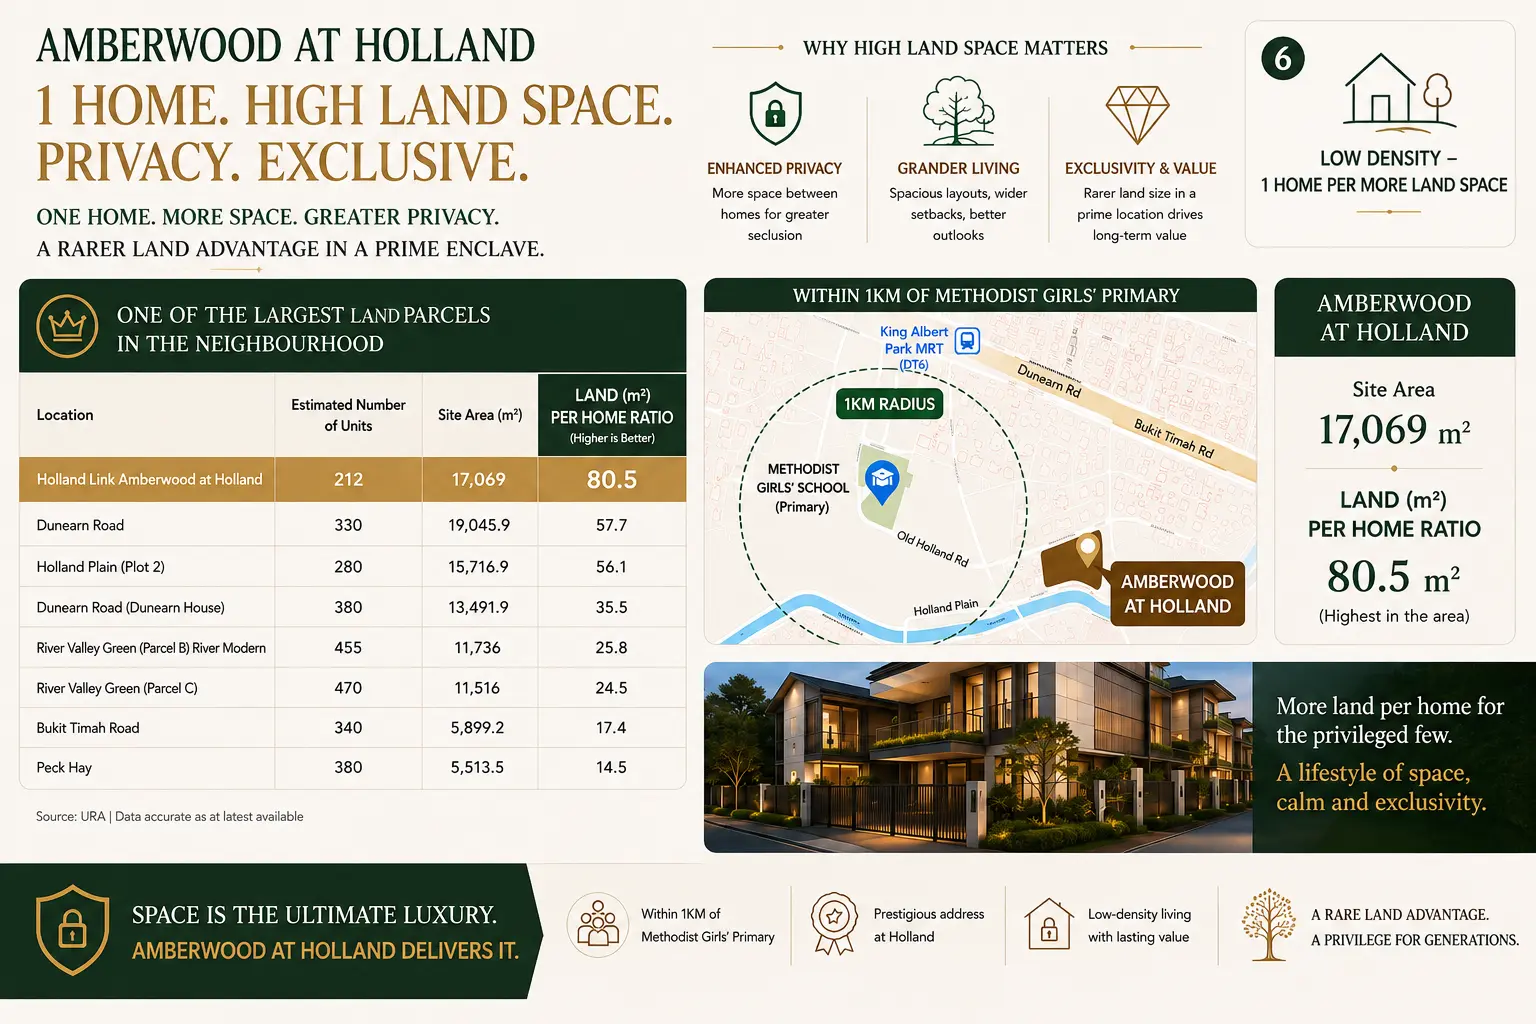
Does each home really get more land here?
Yes. Of everything being claimed about this project, this is the part that stands up best.
Divide the 17,069 sqm site by 212 homes and each home gets 80.5 sqm of land. Compare that with nearby projects, using the unit counts published when each plot was sold.
| Project or site | Land per home | Compared with Amberwood |
|---|---|---|
| Amberwood at Holland | 80.5 sqm | — |
| Dunearn Road | 57.7 sqm | 28% less |
| Holland Plain (Parcel B) | 56.1 sqm | 30% less |
| River Valley Green (Parcel B) | 25.8 sqm | 68% less |
| Peck Hay Road | 14.5 sqm | 82% less |
Amberwood gives each home more than five times the land of the most tightly packed project on that list. In practice that means more space between blocks, more greenery and fewer neighbours. It is a genuinely different kind of home.
But notice where that space comes from. The building limit that forced the developer to build low is the same limit that left so much open land around the blocks. It is also the reason the land sold cheaply.
So the cheap land and the extra space are not two separate wins. They are the same rule, producing both. If you are told the land was a bargain and that each home gets unusual space, understand that you are being told one thing twice.
There is also a cost attached. Maintenance fees for the grounds will be shared by only 212 households, spread across 183,731 sq ft. Fewer households sharing a large estate usually means higher monthly fees per home. The developer has not published that figure yet. Ask for it at the preview.
The unit mix tells you the most
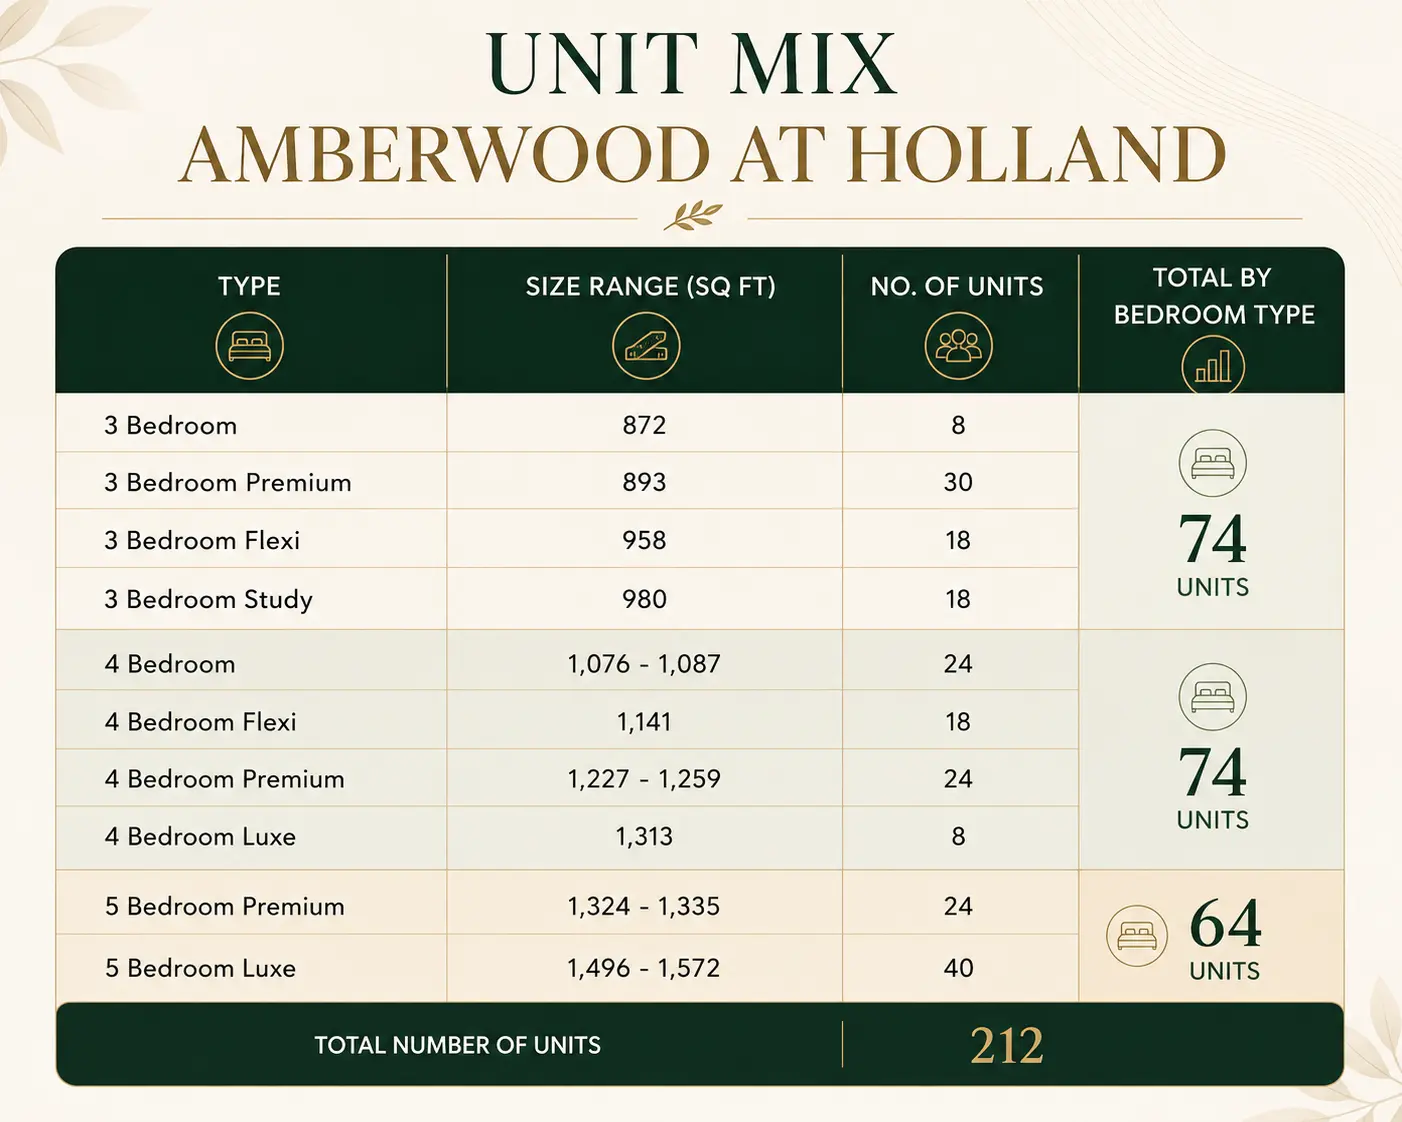
Amberwood at Holland has no one-bedroom and no two-bedroom units at all. Every one of the 212 homes has at least three bedrooms.
| Type | Units | Size from |
|---|---|---|
| 3-bedroom | 74 | 872 sq ft |
| 4-bedroom | 74 | 1,076 sq ft |
| 5-bedroom | 64 | 1,324 sq ft |
| Total | 212 | — |
Here is the part that shows how deliberate this was. URA allowed up to 233 homes on the plot. Sim Lian built 212, which is 21 fewer than it was permitted. So the developer gave up 21 saleable homes in order to make the remaining ones larger. That is a choice, not a constraint, and it has consequences worth understanding.
Small units are the easiest part of any launch to sell. They cost the least in total, so more buyers can afford them, and they usually sell first. Dropping them means every buyer here must be able to afford a three-bedroom home in the central region. At our estimated price range, the smallest 872 sq ft unit would cost roughly $2.6 million to $3.05 million (est.), before you add any optional upgrades.
What the developer gets in return is a quieter development, with more people who live in their own homes rather than rent them out, and fewer neighbours moving in and out. What it accepts is a smaller pool of buyers, both at launch and later when owners want to sell.
What the past projects do and do not prove
The seminar showed past price gains for eight nearby projects, taken from URA data through ERA's SALES+ platform. Here they are in full, with the annualised return added by us.
| Project | Age | Gain per sq ft | Total gain | Per year |
|---|---|---|---|---|
| Within 1km of Methodist Girls' School (Primary) | ||||
| The Nexus | ~23 yrs | +$1,704 | +236% | 5.4% |
| Maple Woods | ~32 yrs | +$1,420 | +182% | 3.3% |
| Casa Esperanza | ~37 yrs | +$1,339 | +200% | 3.0% |
| The Cascadia | ~19 yrs | +$1,033 | +70% | 2.8% |
| Floridian | ~17 yrs | +$635 | +38% | 1.9% |
| Next to green space | ||||
| The Raintree | ~23 yrs | +$1,132 | +252% | 5.6% |
| Southhaven II | ~31 yrs | +$1,169 | +185% | 3.4% |
| Springdale Condo | ~30 yrs | +$729 | +76% | 1.9% |
Look at the last column, because it tells you the most. The headline gains run from 38 per cent to 252 per cent, which sounds like an enormous spread. Divide each one by the number of years the home was held, and the range narrows sharply: 1.9 to 5.6 per cent a year, with a middle value of about 3.2 per cent.
Read that way, the numbers cut both ways, and both sides are worth stating.
In the location's favour. Every one of the eight made money. Those holding periods of 17 to 37 years cover the 1997 Asian financial crisis, the 2008 crash, Covid, and roughly a decade of cooling measures. Not one of the eight lost money across all that. Two of them, The Nexus and The Raintree, returned more than 5 per cent a year, which is a strong result for residential property held that long. This part of District 10 has clearly held its demand.
What it does not support. A headline of "+236 per cent" and a reality of "5.4 per cent a year" are the same fact, but they land very differently, and only one of them is a fair basis for a decision. Note too that the weakest performer, Floridian at 1.9 per cent a year, is the youngest of the eight at 17 years. Springdale Condo also returned 1.9 per cent, despite being held for 30 years. Long holding periods produced the big headline percentages. They did not reliably produce the best yearly returns.
None of it tells you what a 2026 buyer will earn. Every one of those homes was bought at 1990s or 2000s prices, under different lending rules and different property taxes. A buyer entering at today's prices starts from a very different place.
There is one more problem with the sample. It only includes projects that still exist and still change hands. Projects that were sold collectively and torn down, or that rarely change hands, simply drop out of the count. The weaker outcomes disappear, so the average looks better than reality. Our study, did new launches beat resale, works through what that means over a realistic holding period.
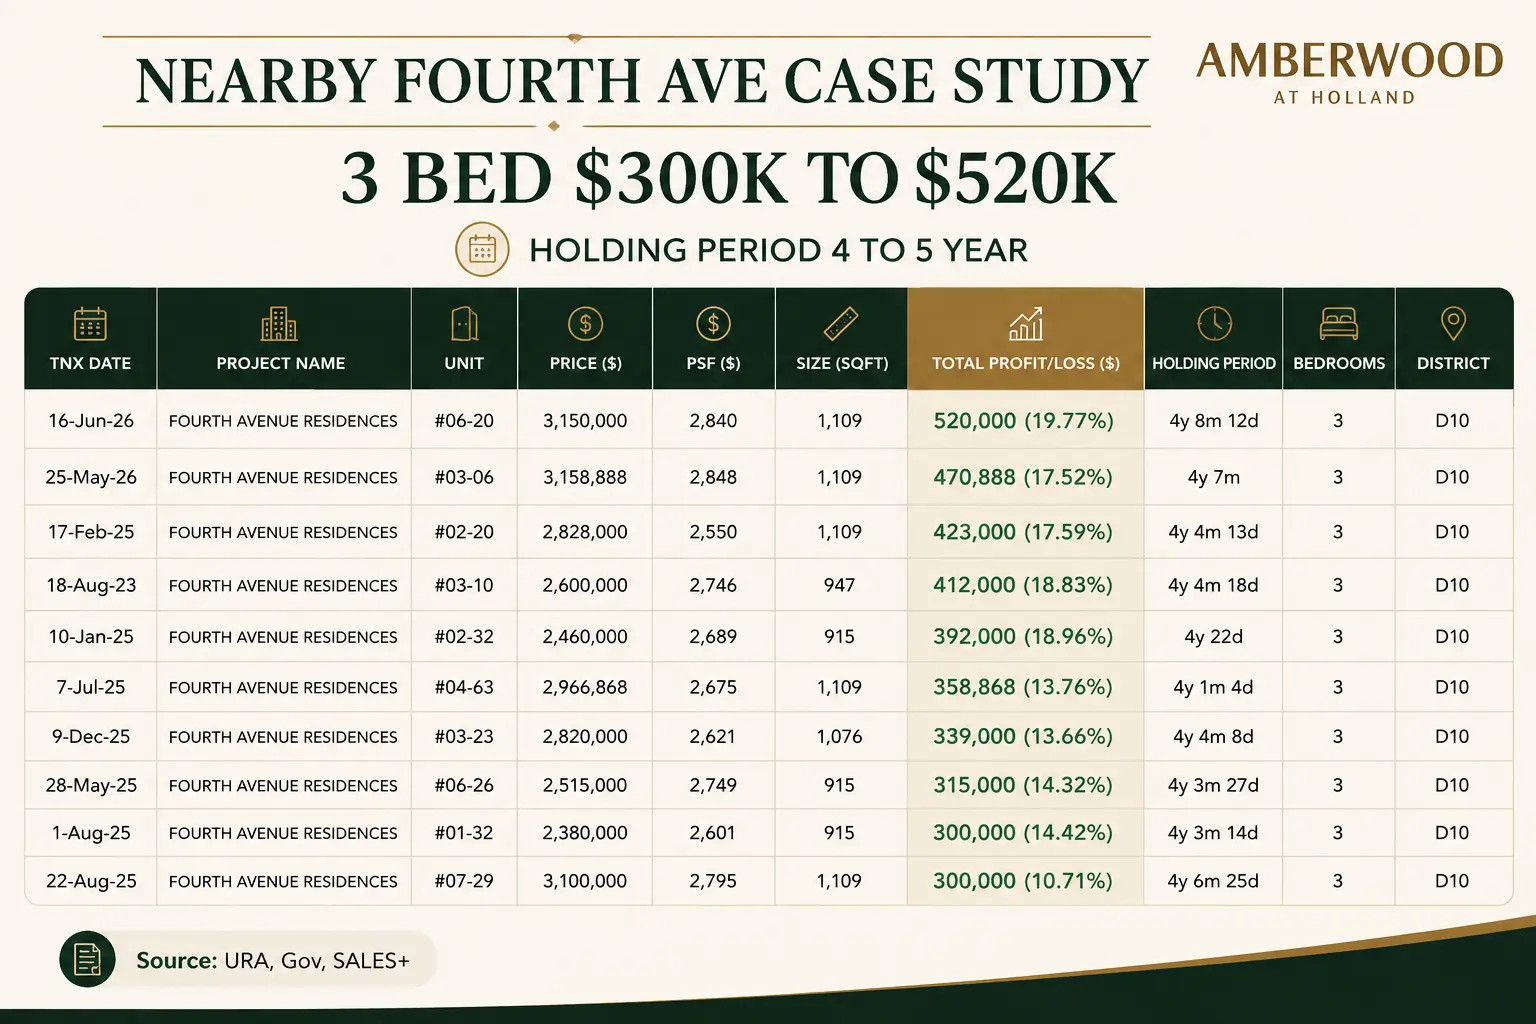
The Fourth Avenue Residences example is more useful. It is recent, and like Amberwood it sits on a 99-year lease, so it is a fairer comparison. Ten three-bedroom units there were resold after being held for four to five years. That is long enough to be past Seller's Stamp Duty, the tax you pay if you sell a property too soon after buying it. Those ten sales produced gains of $300,000 to $520,000, or 10.7 to 19.8 per cent. Those figures are before legal fees, agent fees and any tax.
No four-bedroom units were resold in that same window. The seminar reads that as larger-home buyers choosing to stay longer. That may well be true. But with zero sales, there is no way to test it either way, so it should not be used as evidence of anything.
Four things that genuinely stand in its favour
We have spent most of this article testing claims, so it is worth being just as clear about what survives the testing. These four are supported by the data, not by the marketing.
1. The low density is real, and it is rare. At 80.5 sqm of land per home, Amberwood gives each household more than five times the land of Peck Hay Road. A six-storey project on a 1.4 plot ratio in the Core Central Region is genuinely uncommon, because that land is usually too valuable to build low on. Whatever you conclude about price, the product itself is not something a buyer can easily find elsewhere in District 10.
2. Central land selling below city-fringe land is unusual. Amberwood's $1,432 psf ppr sits below Tanjong Rhu Road at $1,455 and Dover Drive at $1,556, both sold in the same cycle in the Rest of Central Region. Part of that is the building limit, as explained above. But not all of it. Our first-half 2026 GLS review found city-fringe land re-pricing upwards faster than low-rise prime land, and this is a clear example.
3. The location has held up through every downturn we can measure. All eight projects in the table above made money, across periods covering 1997, 2008 and Covid, at a middle return of about 3.2 per cent a year. That is not a forecast, and it is not spectacular. But a location where nothing lost money across three crises is a real and measurable strength.
4. The second plot already sold higher. Parcel B went for $1,491 psf ppr, 4.1 per cent above the first plot nine months earlier. It is a single data point and it drew only one bid, but it is direct evidence, and it points the way the first-mover argument says it should. Applied to our pricing model, it suggests the second project launches nearer $3,130 psf (est.) than $3,010.
Four things that could go wrong
And here is the other side of the ledger.
1. The estate is a plan, not a promise. The wetland park, the community plain and the green corridors are intentions in the Master Plan. No completion dates have been published, and no funding has been confirmed. And whoever buys into the first project will live beside six building sites for longer than anyone else in the estate.
2. The comparison works both ways. The argument assumes later plots will sell for more and pull this project's value up with them. But if the remaining six plots are released into a weaker market, or a developer picks one up cheaply, the benchmark price for the whole estate drops instead. Parcel B drawing only one bid is why this deserves to be taken seriously.
3. The low land price is mostly explained already. Once you account for the 1.4 plot ratio and the six-storey limit, the discount looks less like a mistake by the market and more like a fair price for a site that is more expensive to build on. Our view is that most of that gap disappears once you make that adjustment.
4. Selling later will be harder by design. A 212-unit development with nothing smaller than three bedrooms, at central-region prices, in an estate where the promised park and green spaces have not been built yet, will have fewer possible buyers than a typical launch. That is acceptable if you plan to live there for a long time. It is a real constraint if you plan to sell in four or five years. Our guide to buying a new launch condo covers what to check first, and the affordability calculator shows what this price range means for your own budget.
What we expect, and what would prove us wrong
We are stating these clearly so you can check them against us later.
- Amberwood at Holland launches between $3,000 and $3,500 psf (est.). If it launches above $3,500, the finishes and scarcity mattered more than the land price, and we would change the multiple we apply to low-rise prime sites. If it launches below $3,000, Sim Lian is pricing for speed against a small pool of buyers.
- Sales will be slower than a similar central-region launch that offers small units. A three-bedroom minimum limits who can afford to buy. If it sells a high share of units on launch weekend, the family-home argument is stronger than we have given it credit for.
- The next Holland Plain plot sells above $1,491 psf ppr. Two rises in a row would confirm land prices in the estate are climbing. A lower price would knock out the core of the first-mover argument, and the single bid for Parcel B makes that a real possibility.
- No facility in the estate is completed before 2030 (est.). If the wetland park or community plain opens much earlier than that, the first-mover case is better than we have given it credit for.
Our ten-year record of land prices is in the land cost tracker, the plots still to come are in the GLS pipeline tracker, and everything preparing to launch is in upcoming launches. On timing, our standing view is set out in buy, wait or upgrade. Long-run resale results are in the price trends dashboard, and the new launch comparison tool puts Amberwood next to everything else.
Frequently asked questions
What is Holland Plain?
Holland Plain is a new housing estate of about 34 hectares off Holland Road in District 10. The URA Master Plan sets aside eight plots there for homes, plus a wetland park and an open green space. Two plots have been sold, both to Sim Lian Group. The first becomes Amberwood at Holland with 212 units. The second, Holland Plain (Parcel B), was sold in May 2026 for about 280 units.
Is Amberwood at Holland really the lowest land price in the Core Central Region?
It is the lowest of the eight Core Central Region plots sold since January 2025 in our land cost dataset, at $1,432 psf ppr against a middle price of $1,625 psf ppr for that group. But the lead is small: two other plots are within $22 of it. And it is not the lowest if you look back further. The Holland Drive plot that became Skye at Holland sold at $1,285 psf ppr in May 2024, about 10 per cent cheaper, in the same district.
Is Amberwood at Holland 30.2 per cent cheaper than recent Core Central Region land?
No. The 30.2 per cent figure measures how much more expensive Peck Hay Road is than Amberwood, starting from Amberwood's lower price. Turned around, Amberwood's land is 23.2 per cent cheaper than Peck Hay Road's. Both describe the same gap, but 23.2 per cent is the figure that answers what a buyer is asking.
Why is the land cheaper if Holland Plain is in the Core Central Region?
Mainly because of how little the site is allowed to build. The Holland Link plot has a plot ratio of 1.4 and a six-storey height limit, set by the Good Class Bungalow Areas around it. Peck Hay Road and River Valley Green are high-rise sites with much higher plot ratios. A low-rise project has fewer square feet to sell, so each one carries more of the fixed building costs. Developers therefore bid less for low-rise land to reach the same profit.
What launch price does the Amberwood at Holland land price point to?
We estimate $3,000 to $3,500 psf (est.). Across projects in our land cost tracker, launch prices come in at about 2.1 times the land price. Applied to $1,432 psf ppr, that gives roughly $3,010 psf, which sets the bottom of our range. The premium finishes push the figure higher, which is why our range runs above that. Nothing is confirmed until the developer prices the units.
Is Amberwood at Holland within 1km of Methodist Girls' School (Primary)?
The seminar material says yes, based on a OneMap School Query, which measures in a straight line. MOE uses its own official home-to-school distance, which can differ. The development has no address yet, so the official distance cannot be confirmed today. Treat the 1km claim as an estimate and verify your specific unit address with OneMap and MOE before relying on it. For context, in 2025 the school balloted at Phase 2C with 45 places and 54 Singapore Citizen applicants living within 1km, so being within 1km meant a ballot, not a guaranteed place.
What happens to the remaining Holland Plain plots?
Six of the eight plots were still unsold as at 3 August 2026. Their release depends on the Government Land Sales programme, so both timing and prices are open. Holland Plain (Parcel B) sold at $1,491 psf ppr in May 2026, 4.1 per cent above the first plot. It is the only direct evidence so far on where prices in the estate are heading, and it drew only one bid.
What returns did nearby projects actually achieve?
The eight projects cited at the seminar are The Nexus, Maple Woods, Casa Esperanza, The Cascadia and Floridian, all within 1km of Methodist Girls' School (Primary), plus The Raintree, Southhaven II and Springdale Condo next to green space. Total gains run from 38 to 252 per cent. But those were held for 17 to 37 years. Converted to a yearly return, the range is 1.9 to 5.6 per cent, with a middle value of about 3.2 per cent. All eight made money, which is a genuine strength of the location.
Do the gains quoted for nearby projects predict how Amberwood at Holland will perform?
No, and they should not be read that way. Those projects are 17 to 37 years old and were mostly bought at 1990s prices, under different lending rules and property taxes. The sample also only counts projects that still exist and still change hands, so weaker outcomes drop out and the average looks better than reality. We treat those gains as evidence that the location has held demand over time, not as a forecast of what a 2026 buyer will earn.
Why is Amberwood at Holland only six storeys?
Because URA set it. Annex 1 of URA's media release of 3 December 2024, which announced the Holland Link tender, lists a maximum building height of six storeys, a site area of 17,069 sqm and a maximum floor area of 23,897 sqm, which works out to a plot ratio of 1.4. The same annex caps the number of homes at 233 to manage traffic, and requires at least 500 sqm for a childcare centre. The six-storey limit is the main reason the land sold cheaply and the main reason each home gets unusual space.
Sources & methodology
Land prices, sale dates, bid counts and estimated unit counts come from the PropertyInsider land cost compilation, built from URA and HDB tender results and published in our land cost tracker. The comparison group is every Core Central Region residential plot sold under Government Land Sales between 1 January 2025 and 15 July 2026, which is eight sites. Collective sales are excluded. The $1,625 psf ppr figure is the middle price of those eight. The May 2024 Holland Drive figure falls outside that window and is included only to show how much the choice of window matters.
The site area of 17,069 sqm, the maximum gross floor area of 23,897 sqm, the six-storey maximum building height, the 233-unit cap and the 500 sqm childcare centre requirement are all taken from Annex 1 of URA's tender announcement of 3 December 2024 (media release pr24-57), which we have read directly. They are not seminar figures. The 1.4 plot ratio is our own calculation from the first two. Our floor space check divides Sim Lian Group's winning bid of $368.37 million by that floor area, reproducing $1,432 psf ppr to within a dollar. The walking distance to King Albert Park MRT is taken from marketing material and has not been independently measured by us; we have flagged it as indicative in the text. Primary 1 figures come from our own schools dataset, compiled from MOE's published 2025 and 2026 results; the 2026 exercise was still running on the day we published.
Details of the building, the unit mix, the land per home figures and the SALES+ case studies are as presented at the ERA consumer seminar of 30 July 2026 by Ryner Koh, Executive Director of Agency, ERA Realty Network. We reproduce them as claims attributed to that seminar, not as figures we have independently verified. The eight past projects cited for price gains are named in this article with the ages and gains presented at the seminar. The yearly return in the final column of that table is our own calculation, compounding each stated total gain over its stated age; it is not a seminar figure. The seminar did not state how the eight projects were selected, so we cannot rule out that nearby projects with weaker results were left out. Floor plans, prices and maintenance fees had not been released at the time of publication. Our launch estimate follows our published pricing methodology.
Disclaimer. This article is independent research, published for general information and education. It is not financial, investment, legal, tax or property advice, and it does not take your personal circumstances into account. Figures marked (est.) are our own estimates, not confirmed by the developer. School distances quoted here are straight-line estimates, not MOE's official home-to-school distance; eligibility for Primary 1 registration is decided by MOE alone. Past results for other projects do not indicate future performance. The expectations above are our own view, stated so they can be proved wrong. Figures are compiled in good faith as at 3 August 2026 but are not guaranteed. This page links to Holland Plain Residences, a marketing site operated by a party connected to the publisher; our related interests are disclosed in our editorial policy.
Update history
- Moved "The short version" summary to the top of the article, right after the opening, so readers get the main points immediately rather than at the end.
- Verified the site's limits against Annex 1 of URA media release pr24-57 directly, and linked it. That primary check also surfaced two conditions absent from the seminar material: a 233-unit cap imposed to manage traffic, and a required childcare centre. Added the individual figures for all eight past projects, with yearly returns calculated by us. Added a section setting out what genuinely stands in the project's favour, added transport, and noted that the cheaper Holland Drive plot was a high-rise site.
- Further clarity pass: replaced abstract phrasing in the summary, spelled out what the estate's unbuilt park and green spaces are, added an everyday example showing how one price gap gives two different percentages, and explained Phase 2B and the 99-year lease comparison.
- Added a plain-English summary section, named the eight past projects cited at the seminar, explained in dollar terms why the 30.2 per cent figure matters to a buyer, and shortened the school distance caveat to a single note.
- Rewritten in plain English for general readers. Land per home and unit mix converted from images into readable tables. The OneMap and MOE distance caveat moved next to the school claim it applies to, and expanded to explain why the two measurements can differ. Added a note that the eight past projects cited for price gains were not named in the source material.
- Published: the two sold Holland Plain plots, the eight-site Core Central Region land price comparison, the correction to the 30.2 per cent figure, the plot ratio explanation, the 2025 Methodist Girls' School Phase 2C ballot data, and the counter-case. Next update when Amberwood pricing is official, and when the next Holland Plain plot is sold.