
Two supply clocks are running in opposite directions in the second half of 2026. A record wave of HDB flats is reaching the resale market, while only about 3,620 new private homes are due to launch. The households selling the first often buy the second. That squeeze, not the price index, is the story.
Most half-year outlooks are a mood. This one had numbers, so it is worth arguing with. On 23 July, Marcus Chu and Eugene Lim showed a market that has stopped sprinting. New-sale prices have been roughly flat since 2023. HDB resale has slipped for two quarters. Yet several launches cleared almost everything on opening weekend. Their advice followed naturally. If you are ready and you have found the right home, buy it. Or as Chu put it, time in the market beats timing the market.
Six terms used in this article
- MOPMinimum Occupation Period. You must live in an HDB flat for five years before you may sell it. Prime and Plus flats need ten
- psfPer square foot. A home's price divided by its floor area, so homes of different sizes can be compared
- SORAThe benchmark rate that most floating home loans here are priced off
- ECExecutive condominium. A condo sold with HDB-style rules and income limits, which becomes fully private after ten years
- Subsidy clawbackA share of your sale price that goes back to HDB when you sell a Prime or Plus flat
- OCR / RCR / CCRThe suburbs, the city fringe, and the prime centre
What is happening in Singapore's property market going into the second half of 2026?
Two things at once. On the private side, supply is tight and demand is strong. Roughly 3,620 new homes are due to launch between July and December. In the first half, take-up hit 99% at Tengah Garden Residences and 100% at Rivelle Tampines. On the public side, the opposite is happening. The HDB Resale Price Index has slipped for two quarters running, by about 0.5% each time, while a record 13,480 flats reach the end of their five-year minimum stay this year.
The 2H 2026 numbers that matter
- Median new-sale price, 1H 2026$2,561 psf
- Median resale condo price, 1H 2026$1,777 psf
- New vs resale gap, 2023 → 1H 2026$908 → $784 psf
- 3M compounded SORA, 2Q 20261.08%
- New homes launching, 2H 2026~3,620
- MOP flats, 2026 / 2027 / 202813,480 / 18,939 / 21,393
Those figures come from URA, HDB and MAS data compiled for the 23 July briefing. Everything below is my reading of them. It also includes one cut of our own dataset that I think changes the conclusion.
Why is the price gap between new and resale condos narrowing?
Because new prices stopped moving and resale prices did not. Median new-sale prices were $2,486 psf in 2023 and $2,561 psf in the first half of 2026. Over three years, that is barely a change. Median resale prices went from $1,578 psf to $1,777 psf over the same period. So the gap between them fell from $908 psf to $784 psf.
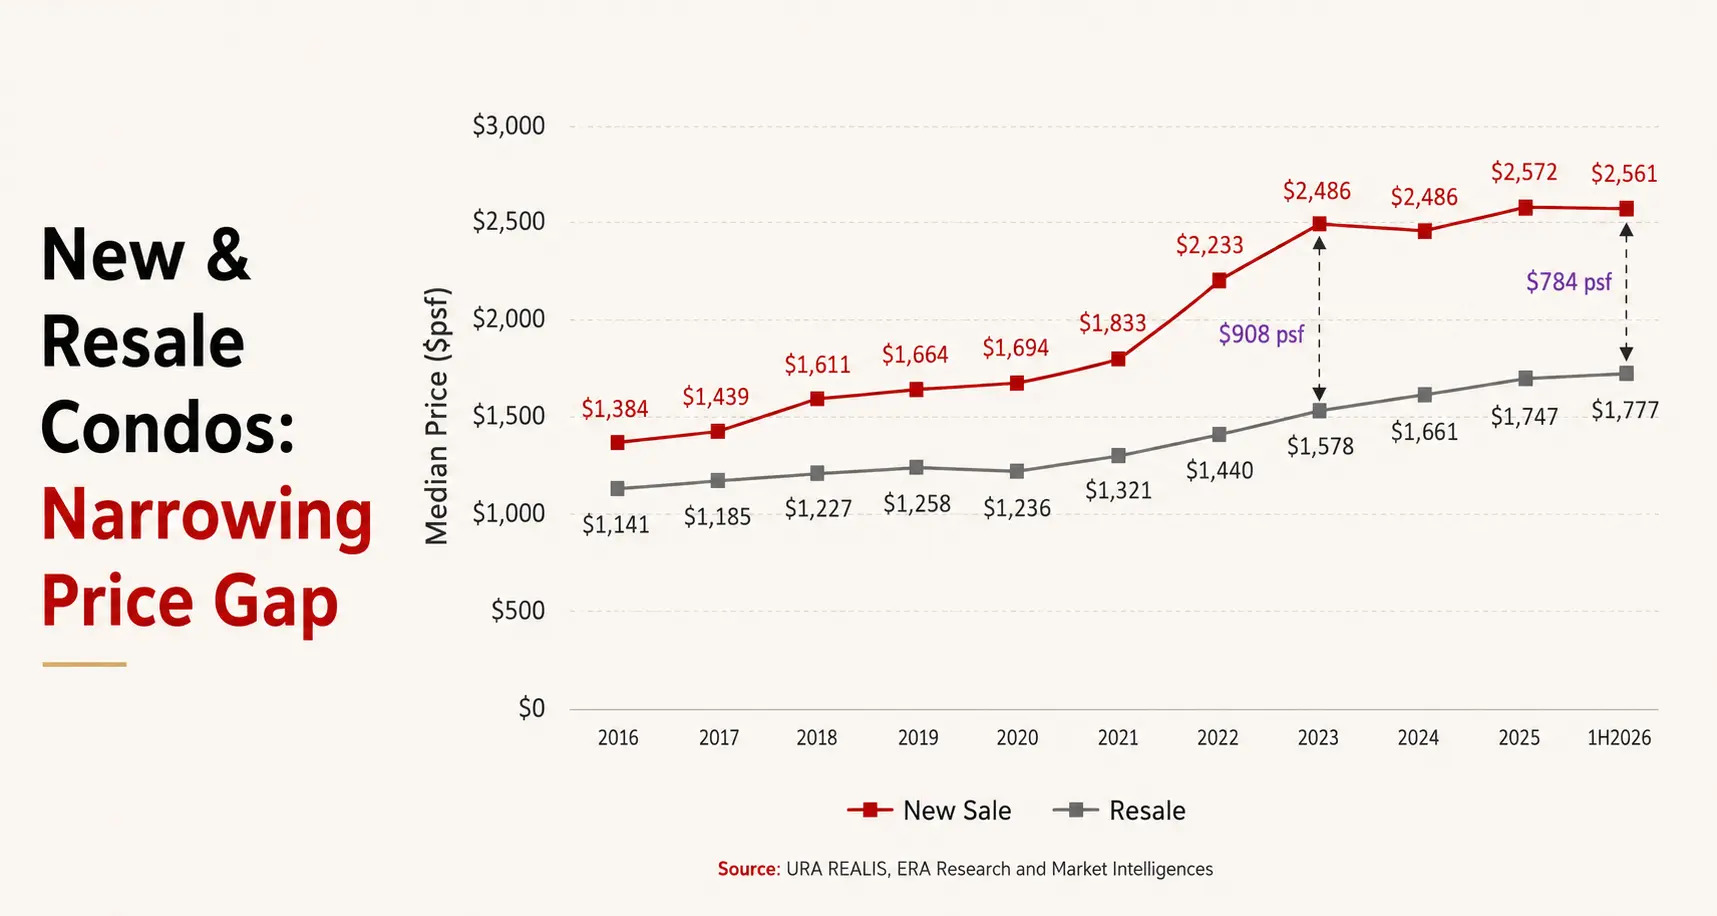
That matters more than it looks. A buyer choosing between a new launch and a resale unit is not just comparing price per square foot. On one side sits a fresh 99-year lease, a modern layout and a developer warranty. On the other sits whatever is left of an older lease. When that extra cost was over $900 psf, plenty of buyers took the older unit and lived with the age. At $784 psf, and with borrowing at 1.08% against a peak of 3.7% in early 2024, the sums tilt the other way. That, not mood, explains the take-up rates.
Here is the caution I give every client who repeats this argument back to me. A narrowing gap is not a discount. It closed because resale went up, not because new launches came down. If you are buying new because the gap narrowed, you are still paying $2,561 psf. Work out the repayment at 3% rather than 1.08% before you sign anything. Our affordability and stamp-duty calculators exist for exactly that.
Are HDB resale prices falling in 2026?
They are flattening, not falling. Two quarters of about 0.5% decline, after years of steady rises, is what the top of a plateau looks like. Resale applications held at 6,285 in the first quarter and about 6,268 in the second. Buyers have not gone on strike. Sellers panicking at the word "decline" are reading a 0.5% move as a trend.
The million-dollar flat headlines muddy this further. There were 903 such sales in the first half of 2026, and the yearly count has climbed steeply since 2021. But set against total resale volume it stays well under 10%. About three quarters of resale flats still change hands below $1 million, mostly between $500,000 and $800,000. The flats crossing the line share a type: a mature estate, a short walk to an MRT station or a good hawker centre and mall, near-new condition and a long lease left. If your flat is none of those, the headlines are not about you.
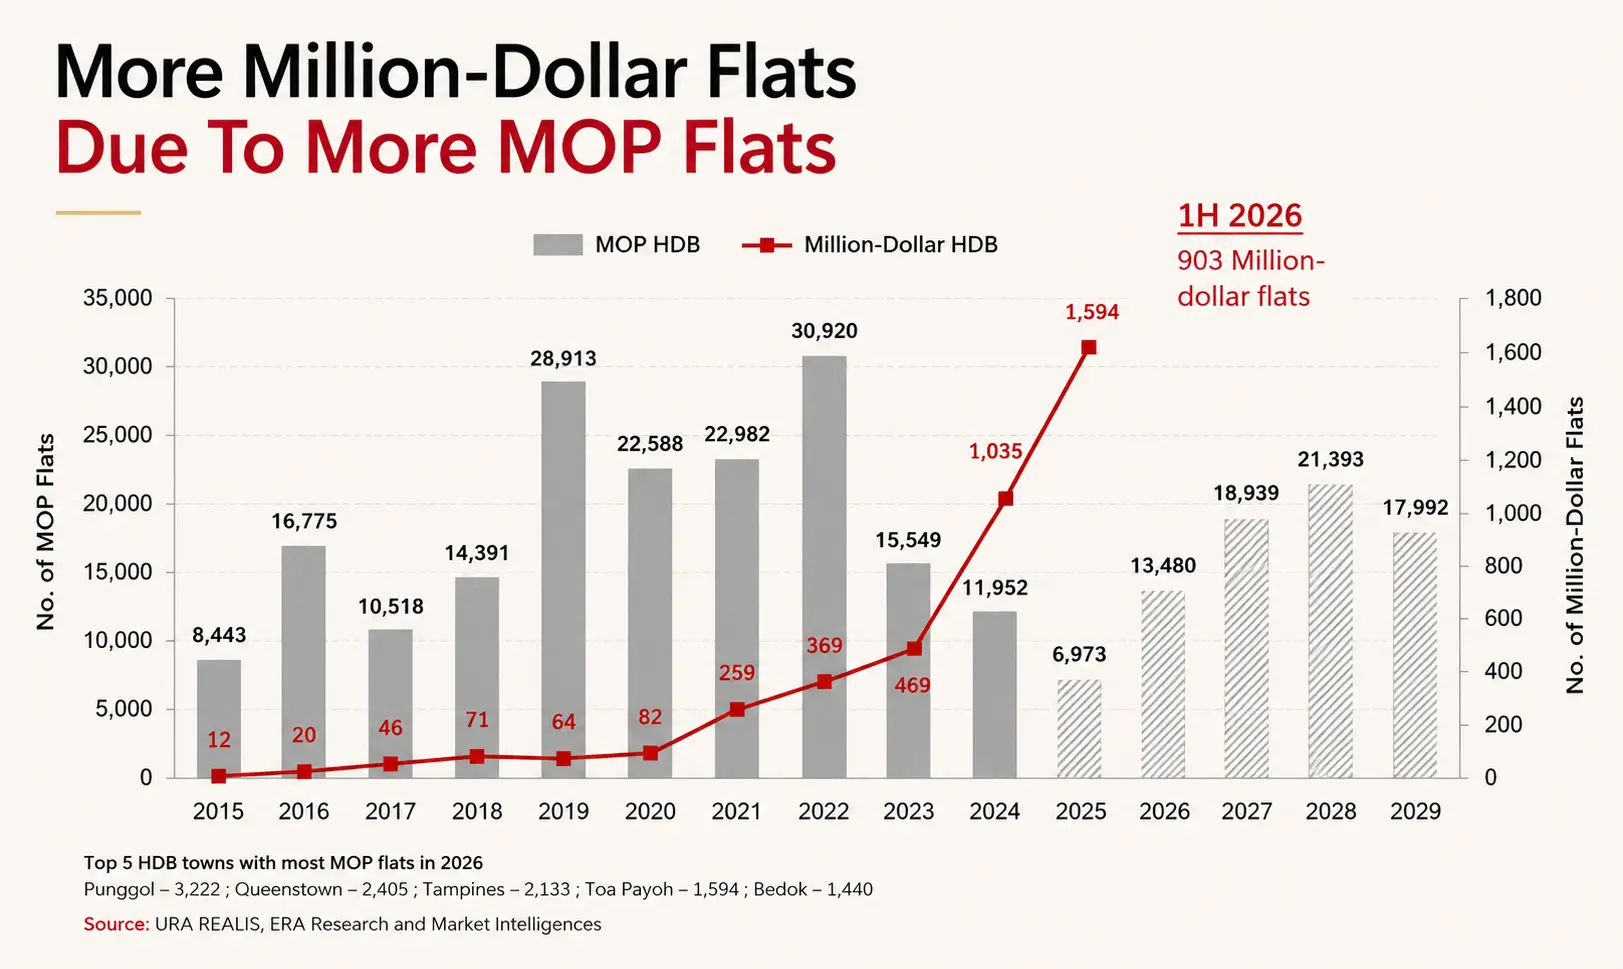
The more useful number is the wave of flats coming free to sell. About 13,480 flats reach the five-year mark in 2026, then 18,939 in 2027 and 21,393 in 2028. The biggest 2026 batches are in Punggol (3,222), Queenstown (2,405), Tampines (2,133), Toa Payoh (1,594) and Bedok (1,440). That is three years of near-new flats arriving into a market whose price index has just stopped rising.
Why do the two supply clocks point in opposite directions?
Here is the join the briefing left unsaid. Public resale supply is growing fast. Private launch supply is unusually tight. These are not separate facts, because the same household often sits on both sides of them. They sell the flat and buy the launch.
On the launch side, ERA Project Marketing counted about 3,620 homes for the second half as of 8 July. That is roughly 3,189 condo units, 420 EC units at Wynwood Grand under the pre-8 May rules, and 11 landed homes. Our own GLS pipeline tracker carries a slightly larger set, mainly because it includes Chuan Grove at around 1,055 units in the fourth quarter, which the ERA schedule did not list. I flag the difference rather than quietly reconcile it. Preview dates on unlaunched sites move, and neither list is wrong. They are simply cut off at different points.
| Project | District / segment | Est. units | Preview | Indicative launch psf |
|---|---|---|---|---|
| Lucerne Grand | D22 · OCR | 575 | 11 Sep 2026 | $2,450–$2,900 (est.) |
| The Serra Residences | D11 · CCR | 133 | Sep/Oct 2026 | $3,000–$3,500 (est.) |
| Amberwood at Holland | D10 · CCR | 230 | Sep/Oct 2026 | $3,000–$3,500 (est.) |
| Thomson Reserve | D20 · RCR | 1,240 | Oct 2026 | $2,450–$2,700 (est.) |
| Chuan Grove GLS | D19 · OCR | 1,055 | Q4 2026 | $2,500–$2,700 (est.) |
| Wynwood Grand (EC) | D25 · OCR | 420 | Q4 2026 | $1,800–$2,100 (est.) |
| Upper Thomson (Parcel A) GLS | D26 · OCR | 595 | Q4 2026 | $2,350–$2,600 (est.) |
| The Island Residence | D04 · CCR | 84 | Q4 2026 | $2,800–$3,300 (est.) |
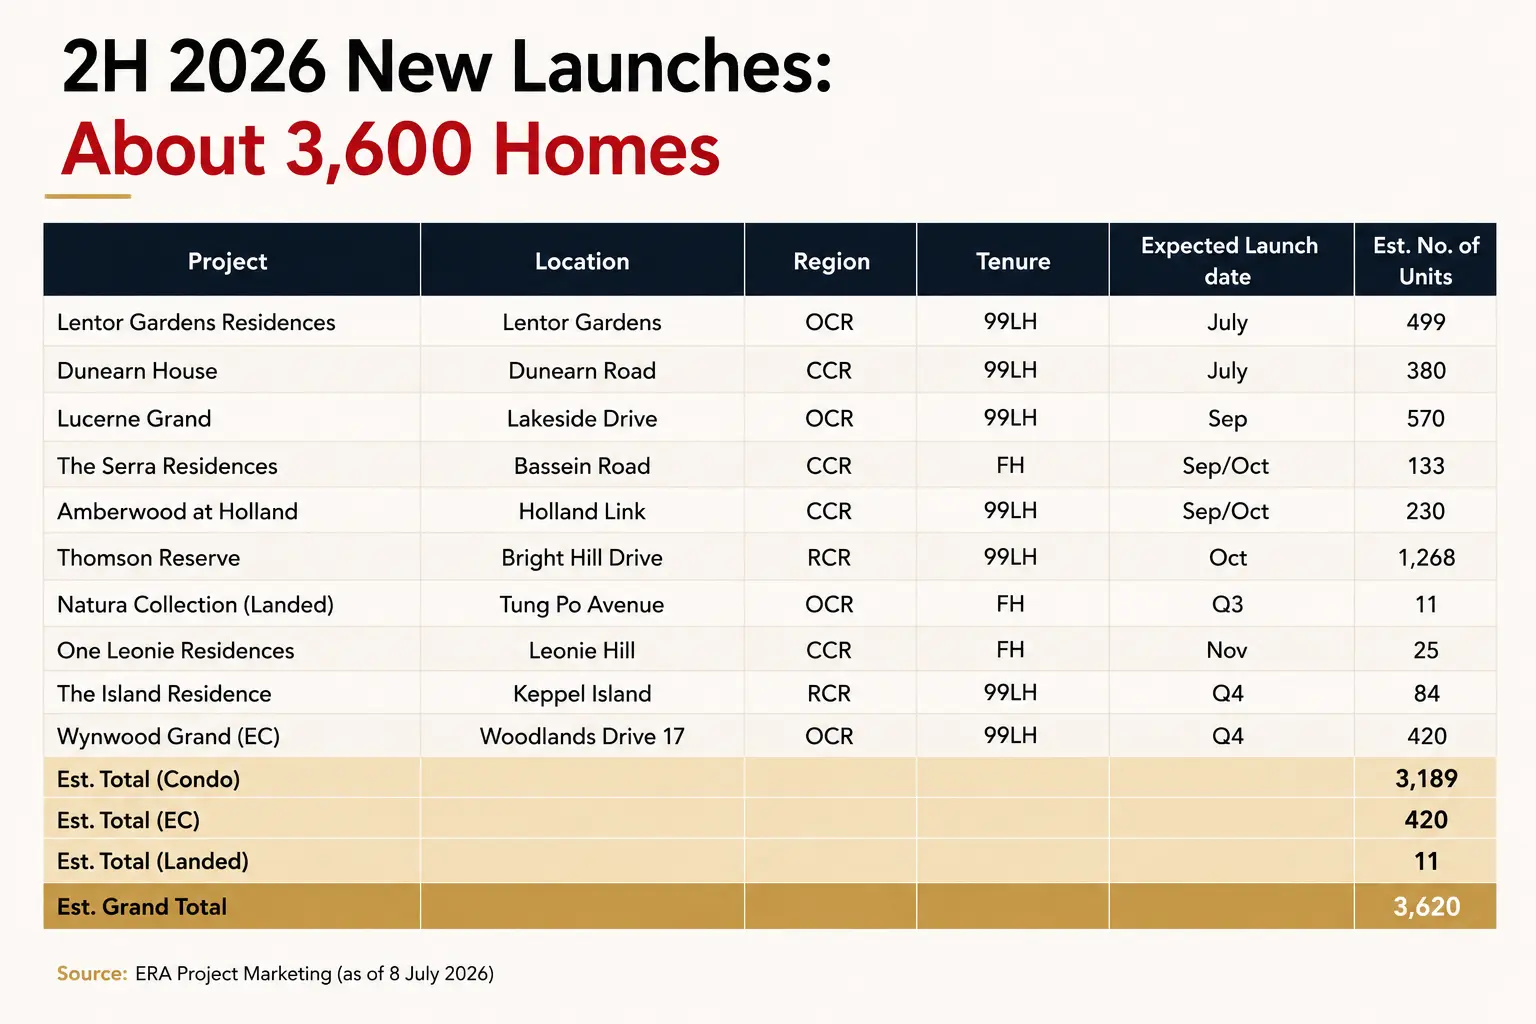
Set 3,620 against the first-half evidence that launches drew three to four interested buyers per available unit, and Chu's practical point follows. If you find the unit, do not spend three weekends thinking about it. My version is a little less urgent. Thin supply in one half-year is a queueing problem, not a law about prices. The 2027 pipeline on our tracker is much larger. It also includes sites bought at record land rates, which will have to be priced in. Waiting is a real strategy. It is just not a free one.
Will Prime and Plus flats reduce the number of upgraders buying private homes?
Probably, but not before the mid-2030s. This was the last of four long-run trends in the briefing, and I think it was the most important slide there. It also came with the biggest hedge, correctly, because nothing here happens soon.
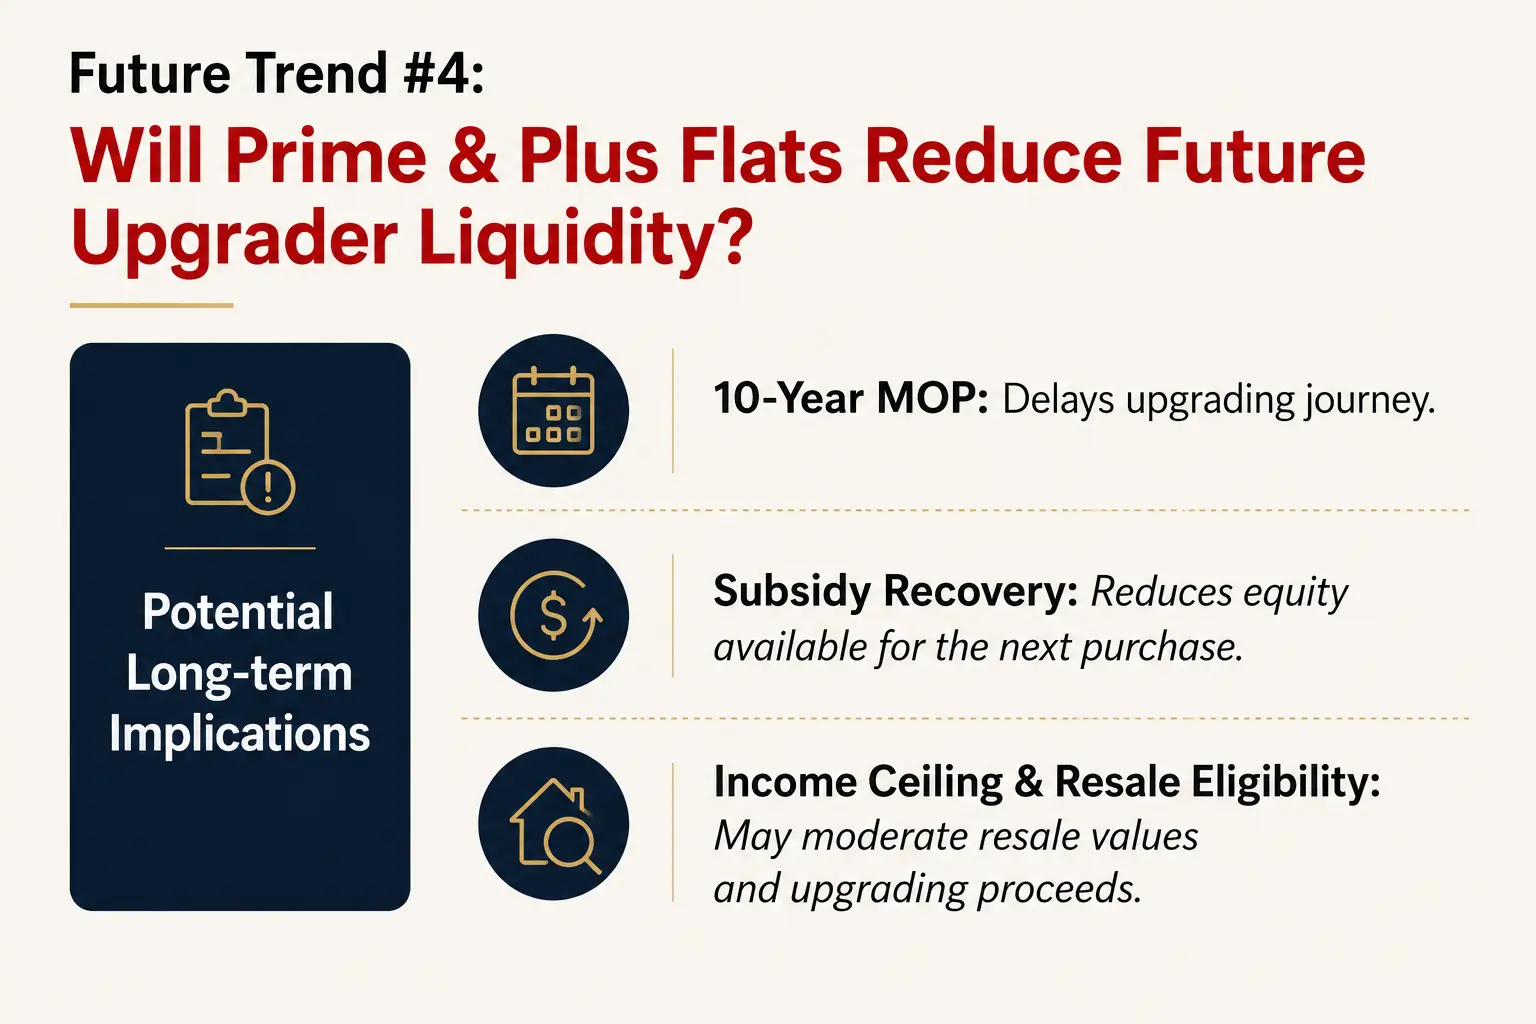
The mechanism is simple. Prime and Plus flats carry a ten-year minimum stay rather than five, so the upgrade clock starts twice as late. A clawback takes a slice of the sale price, so less cash comes out. And a $14,000 household income ceiling on who may buy the flat limits the pool of bidders, which limits the price. Delay the sale. Shrink the proceeds. Cap the buyers. Each one alone is manageable. All three together change what an upgrader can afford next.
This matters beyond public housing, because HDB upgraders have quietly funded the private market for decades. Here is a cut of our own data that I have not seen published anywhere else. Across the 67 selling projects we track with buyer-profile data, HDB upgraders are a median 42.5% of buyers in suburban launches, 28.3% on the city fringe and 18.7% in the prime centre.
| Segment | Projects tracked | Median HDB-upgrader share |
|---|---|---|
| OCR (Outside Central Region) | 25 | 42.5% |
| RCR (Rest of Central Region) | 27 | 28.3% |
| CCR (Core Central Region) | 15 | 18.7% |
Read those two things together. A policy that thins the flow of upgraders does not hit the market evenly. It hits hardest where upgraders are two buyers in five, and that is the suburban mass market, not Orchard. If you own a suburban unit and expect to sell in the mid-2030s, keep that number on the wall. To be fair to the briefing, it is also a decade of possible policy changes away from being certain. HDB has moved income ceilings before.
Which trends would I weight differently?
Three of the four long-run trends in the deck were about population. On ageing and shrinking households, I think the presenters were too gentle. One in five citizens is already 65 or over, and that becomes one in four after 2030. The quieter half is household formation. One-person and two-person households have grown steadily since 2015, while larger households have flattened. Split one six-person household into three two-person households and the population has not changed at all. But the number of homes needed has tripled. That is the strongest demand argument available here, and it does not depend on immigration policy holding.
The right-sizing point follows from it, and gets too little attention. As retirees move out of five-room and executive flats, those flats become the resale supply that growing families are short of today. If you are hunting a large resale flat, the next few years should be kinder than the last few.
The fourth trend, the future of work and AI, I would drop from a property outlook. The argument runs that AI reshapes jobs, jobs drive income, and income drives housing choices. It is true, but at a level so general that there is no way to test it either way. It tells you nothing about a purchase in the next 18 months. The ERA and Ngee Ann Polytechnic My Dream Home survey in the same section was far more useful. Flexible layouts were the most requested feature in every age band: 54% among 21 to 35s and 63% among 60 to 69s. That is a real thing to check on a floor plan.
Where could this reading be wrong?
Three ways, and I would revise on any of them.
The first is rates. Every affordability argument here rests on borrowing near 1.08%. A rate that fell 2.62 percentage points in two years can climb back faster than anyone's plan allows. The briefing said as much. I would put it higher on the risk list, because the size of loan you qualify for is worked out using the rate of the day.
The second is policy. The May 2026 EC changes lifted the first-timer share from 70% to 90% and applied a ten-year minimum stay to sites sold from 8 May. That is proof the rules can move against a group overnight. I wrote about it in The new shape of Singapore housing demand. Any plan that depends on an EC being available to a second-timer is standing on thin ice.
The third is my own upgrader argument. It rests on buyer-profile data for 67 projects, several small enough that a handful of sales moves the percentage. It also rests on a Prime and Plus resale market that does not exist yet and will not for another 10 to 15 years. If HDB raises the $14,000 ceiling in step with incomes, most of the price-capping effect disappears. I hold the direction with more confidence than the size.
What would I actually do in the second half of 2026?
For first-timers, October brings the last BTO exercise of 2026. The Bedok and Bayshore projects sit next to a station, in an area where private launches have already sold well. The system is built to favour you, so use it while that is true. And remember your first flat does not need to be your last. Eligibility questions belong with HDB, not with me.
For upgraders, the honest advice is to stop waiting for a BTO or EC ballot that the new rules have made a long shot. The 13,480 flats reaching the resale market this year are near-new, and they come without a five-year wait. The resale index has been flat for two quarters. That combination has not been available for a while. Our buyer guides cover the order you should do things in, and the calculators handle the cash and CPF side.
For investors, the argument about areas being transformed is sound, but it needs a filter. Everywhere in Singapore is on some version of the Master Plan. The filter I use is whether the infrastructure is funded and dated, rather than merely drawn. Beyond that, land is the early signal for launch prices. Our land cost dataset and the 1H 2026 GLS review show how tender prices have fed launch prices, and I keep my own site-by-site notes for clients choosing between today's launches and tomorrow's dearer ones.
Everyone else should note the shape of this. Public housing supply is loosening while private launch supply tightens. And the bridge between them is being narrowed for the generation after this one. Prices are the noisy part. The bridge is the part I would watch.
The short version — read this first
Seven things to remember from all of the above.
What we found
- Two clocks, opposite directionsResale flat supply is growing fast. New launch supply is unusually thin. The same household often sits on both sides
- The new-versus-resale gap has closedFrom $908 psf in 2023 to $784 psf now. It closed because resale rose, not because new launches got cheaper
- HDB resale has levelled offTwo quarters of about −0.5%. Applications held near 6,285 and 6,268, so buyers have not walked away
- Million-dollar flats are the exceptionUnder 10% of sales. About three quarters still change hands below $1 million
- A wave of near-new flats is coming13,480 flats pass the five-year mark in 2026, then 18,939 in 2027 and 21,393 in 2028
- Thin launch supply, for nowAbout 3,620 new homes in the second half. The 2027 pipeline is much larger, but built on dearer land
- Our own findingAcross 67 projects we track, HDB upgraders are a median 42.5% of buyers in suburban launches, 28.3% on the city fringe and 18.7% in the prime centre
So what should you do with this?
- If you are upgrading, price a near-new resale flat against the BTO or EC ballot you were waiting for. The odds on the ballot have got worse.
- If you are buying a new launch, work out the monthly repayment at 3%, not at today's 1.08%.
- If you own a suburban condo and plan to sell in the mid-2030s, watch the Prime and Plus rules. That is where the upgrader flow thins first.
Frequently asked questions
Are HDB resale prices falling in 2026?
They are flattening rather than falling. The index slipped for two quarters in 2026, by roughly 0.5% each time on the second-quarter flash estimate shown at the July 2026 Realty Talk. After years of steady rises, two small dips read as stabilisation, not a correction. Application volumes have held up, at 6,285 in the first quarter and about 6,268 in the second.
How many new condominiums are launching in Singapore in 2H 2026?
About 3,620 new homes, on ERA Project Marketing figures as of 8 July 2026. That splits into roughly 3,189 condo units, 420 EC units at Wynwood Grand under the pre-8 May rules, and 11 landed homes. Our own tracker carries a slightly larger second-half set, because it includes Chuan Grove at around 1,055 units, which the ERA schedule did not list.
Why is the price gap between new and resale condos narrowing?
Because new prices have been flat since 2023 while resale kept rising. On URA figures, median new-sale prices were $2,486 psf in 2023 and $2,561 psf in the first half of 2026. Median resale rose from $1,578 psf to $1,777 psf. The gap fell from $908 psf to $784 psf. That makes a fresh 99-year lease easier to justify against an older unit.
How many MOP flats are reaching the Singapore resale market?
About 13,480 flats complete their five-year minimum stay in 2026. That rises to roughly 18,939 in 2027 and 21,393 in 2028, on HDB and ERA figures. The biggest 2026 batches are in Punggol (3,222), Queenstown (2,405), Tampines (2,133), Toa Payoh (1,594) and Bedok (1,440).
Will Prime and Plus flats reduce the number of HDB upgraders buying private property?
Probably, though not before the mid-2030s. A ten-year minimum stay delays the upgrade. The subsidy clawback reduces the cash that comes out. And a $14,000 income ceiling on resale buyers caps the price. The exposure is uneven. Across the 67 selling projects we track with buyer-profile data, HDB upgraders are a median 42.5% of buyers in suburban launches, against 28.3% on the city fringe and 18.7% in the prime centre.
Are all MOP flats million-dollar flats?
No. Million-dollar sales stay well under 10% of yearly HDB resale volume, and about three quarters of flats change hands below $1 million, commonly between $500,000 and $800,000. The ones that cross $1 million usually share three things: a mature estate, a short walk to an MRT station or major shops, and near-new condition with a long lease left.
Should I buy a new launch now or wait until 2027?
That depends on your income stability, your savings buffer, whether you would pay Additional Buyer's Stamp Duty, and how long you plan to hold. Nothing here is financial advice. The case for acting now is thin supply, about 3,620 homes, against take-up that reached 99% and 100% on some first-half projects. The case for waiting is a much larger 2027 pipeline, though several of those sites were bought at record land rates that must be priced in.
Sources: ERA Singapore Realty Talk consumer webinar, "Looking Into The Future: 2H 2026 Starts Here", presented by CEO Marcus Chu and KEO Eugene Lim, 23 July 2026, drawing on URA REALIS private transaction data, HDB resale and MOP statistics, MAS 3-month compounded SORA, SingStat household and population data, the ERA and Ngee Ann Polytechnic My Dream Home survey, and ERA Research and Market Intelligence; ERA Project Marketing launch schedule as of 8 July 2026. Figures reproduced with attribution. Buyer-profile and pipeline statistics are PropertyInsider.sg's own compilation as at 29 July 2026. Figures marked (est.) are analyst estimates produced under our pricing methodology and are not developer-confirmed. Eligibility questions should be directed to HDB. Nothing on this page is financial or property advice.
Page history: 29 Jul 2026 — first published. Figures will be revised when 2Q 2026 HDB data is finalised, when 2H 2026 preview dates are confirmed, and after each of the two EC tenders closing this half.